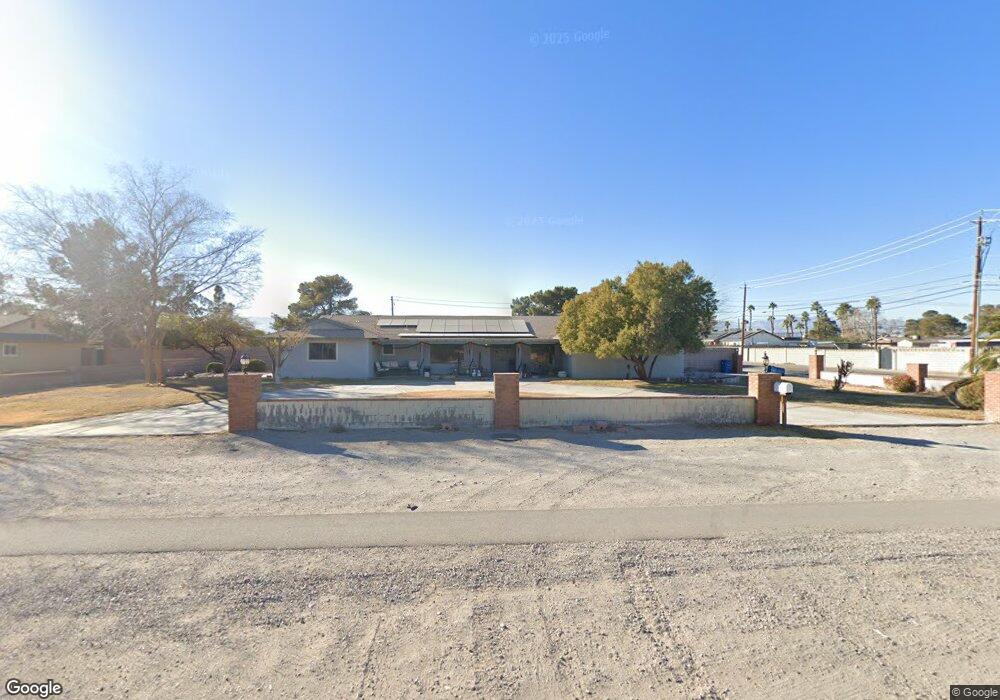
7615 S Valley View Blvd Las Vegas, NV 89139
Coronado Ranch NeighborhoodEstimated Value: $902,329 - $937,000
5
Beds
3
Baths
3,088
Sq Ft
$298/Sq Ft
Est. Value
About This Home
This home is located at 7615 S Valley View Blvd, Las Vegas, NV 89139 and is currently estimated at $921,332, approximately $298 per square foot. 7615 S Valley View Blvd is a home located in Clark County with nearby schools including Dr. Beverly S. Mathis Elementary School, Lawrence & Heidi Canarelli Middle School, and Desert Oasis High School.
Ownership History
Date
Name
Owned For
Owner Type
Purchase Details
Closed on
Mar 22, 2017
Sold by
Lackie Phyllis J
Bought by
Lackie Phyllis and The Phyllis Lackie Revocable Living Tru
Current Estimated Value
Purchase Details
Closed on
Sep 6, 2005
Sold by
Lackie Phyllis J
Bought by
Lackie Phyllis J
Home Financials for this Owner
Home Financials are based on the most recent Mortgage that was taken out on this home.
Original Mortgage
$189,500
Interest Rate
5.76%
Mortgage Type
New Conventional
Purchase Details
Closed on
May 22, 2003
Sold by
Lackie Phyllis J
Bought by
Lackie Phyllis J
Home Financials for this Owner
Home Financials are based on the most recent Mortgage that was taken out on this home.
Original Mortgage
$149,000
Interest Rate
5.75%
Mortgage Type
Unknown
Purchase Details
Closed on
Mar 10, 1998
Sold by
Lackie Curtis Floyd
Bought by
Lackie Phyllis J
Create a Home Valuation Report for This Property
The Home Valuation Report is an in-depth analysis detailing your home's value as well as a comparison with similar homes in the area
Home Values in the Area
Average Home Value in this Area
Purchase History
| Date | Buyer | Sale Price | Title Company |
|---|---|---|---|
| Lackie Phyllis | -- | None Available | |
| Lackie Phyllis J | -- | Netco Title | |
| Lackie Phyllis J | -- | Fidelity National Title | |
| Lackie Phyllis J | -- | United Title |
Source: Public Records
Mortgage History
| Date | Status | Borrower | Loan Amount |
|---|---|---|---|
| Closed | Lackie Phyllis J | $189,500 | |
| Closed | Lackie Phyllis J | $149,000 |
Source: Public Records
Tax History Compared to Growth
Tax History
| Year | Tax Paid | Tax Assessment Tax Assessment Total Assessment is a certain percentage of the fair market value that is determined by local assessors to be the total taxable value of land and additions on the property. | Land | Improvement |
|---|---|---|---|---|
| 2025 | $3,290 | $171,663 | $105,000 | $66,663 |
| 2024 | $3,195 | $171,663 | $105,000 | $66,663 |
| 2023 | $3,195 | $162,159 | $96,250 | $65,909 |
| 2022 | $3,102 | $139,174 | $77,000 | $62,174 |
| 2021 | $3,012 | $130,347 | $70,000 | $60,347 |
| 2020 | $2,921 | $131,069 | $70,000 | $61,069 |
| 2019 | $2,836 | $122,633 | $61,250 | $61,383 |
| 2018 | $2,753 | $112,978 | $52,500 | $60,478 |
| 2017 | $3,119 | $106,362 | $43,750 | $62,612 |
| 2016 | $2,607 | $107,997 | $43,750 | $64,247 |
| 2015 | $2,602 | $92,003 | $28,000 | $64,003 |
| 2014 | $2,521 | $83,404 | $21,000 | $62,404 |
Source: Public Records
Map
Nearby Homes
- 7655 S Valley View Blvd
- 7416 Innovation Peak Ct
- 7417 Serene Horizon Ct
- Robert Plan at Teton Terrace - Aspire Collection
- Rowan Plan at Teton Terrace - Aspire Collection
- Rocco Plan at Teton Terrace - Aspire Collection
- Robert Plan at Eldorado Valley - Aspire Collection
- Rocco Plan at Eldorado Valley - Aspire Collection
- Rowan Plan at Eldorado Valley - Aspire Collection
- 7448 Serene Horizon Ct
- 0 W Maulding Ave
- 4315 W Maulding Ave
- 3460 W Mesa Verde Ln
- 7270 Hinson St
- 7210 El Malpais St
- 4222 W Warm Springs Rd
- Luminary Plan at Daylight
- Layton Plan at Daylight
- Royalty II Plan at Daylight
- Royalty Plan at Daylight
- 7635 S Valley View Blvd
- 7575 S Valley View Blvd
- 3890 W Maulding Ave
- 7620 S Valley View Blvd
- 7555 S Valley View Blvd
- 7640 S Valley View Blvd
- 7580 Schuster St
- 7675 S Valley View Blvd
- 3874 W Robindale Rd
- 7660 S Valley View Blvd
- 7560 Schuster St
- 7535 S Valley View Blvd
- 7680 S Valley View Blvd
- 3685 W Maulding Ave
- 7585 Schuster St
- 3665 W Maulding Ave
- 7550 Schuster St
- 7651 Schuster St
- 7515 S Valley View Blvd
- 3660 W Robindale Rd