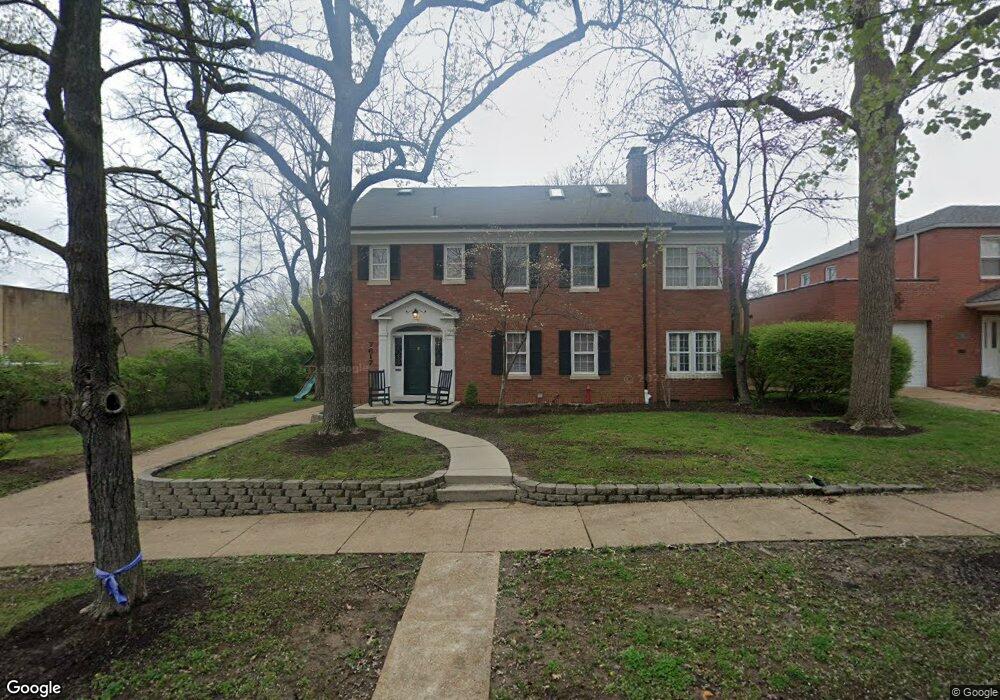
7617 Gannon Ave Saint Louis, MO 63130
Estimated Value: $632,000 - $899,000
3
Beds
4
Baths
3,119
Sq Ft
$251/Sq Ft
Est. Value
About This Home
This home is located at 7617 Gannon Ave, Saint Louis, MO 63130 and is currently estimated at $783,086, approximately $251 per square foot. 7617 Gannon Ave is a home located in St. Louis County with nearby schools including Jackson Park Elementary School, Brittany Woods Middle School, and University City High School.
Ownership History
Date
Name
Owned For
Owner Type
Purchase Details
Closed on
May 6, 2013
Sold by
Abrams Shepherd M
Bought by
Oppenheimer Dalia N and Glogower Jeffrey M
Current Estimated Value
Home Financials for this Owner
Home Financials are based on the most recent Mortgage that was taken out on this home.
Original Mortgage
$340,000
Outstanding Balance
$242,328
Interest Rate
3.61%
Mortgage Type
New Conventional
Estimated Equity
$540,758
Purchase Details
Closed on
Apr 4, 2009
Sold by
Abrams Shepherd M and Abrams Marianne
Bought by
Abrams Shepherd M
Home Financials for this Owner
Home Financials are based on the most recent Mortgage that was taken out on this home.
Original Mortgage
$292,000
Interest Rate
5.24%
Mortgage Type
Purchase Money Mortgage
Purchase Details
Closed on
Jul 31, 2000
Sold by
Soliman Iris E
Bought by
Abrams Shepherd M and Abrams Marianne
Home Financials for this Owner
Home Financials are based on the most recent Mortgage that was taken out on this home.
Original Mortgage
$312,000
Interest Rate
8%
Create a Home Valuation Report for This Property
The Home Valuation Report is an in-depth analysis detailing your home's value as well as a comparison with similar homes in the area
Home Values in the Area
Average Home Value in this Area
Purchase History
| Date | Buyer | Sale Price | Title Company |
|---|---|---|---|
| Oppenheimer Dalia N | $425,000 | Insight Title | |
| Abrams Shepherd M | -- | None Available | |
| Abrams Shepherd M | $390,000 | -- |
Source: Public Records
Mortgage History
| Date | Status | Borrower | Loan Amount |
|---|---|---|---|
| Open | Oppenheimer Dalia N | $340,000 | |
| Previous Owner | Abrams Shepherd M | $292,000 | |
| Previous Owner | Abrams Shepherd M | $312,000 |
Source: Public Records
Tax History Compared to Growth
Tax History
| Year | Tax Paid | Tax Assessment Tax Assessment Total Assessment is a certain percentage of the fair market value that is determined by local assessors to be the total taxable value of land and additions on the property. | Land | Improvement |
|---|---|---|---|---|
| 2025 | $8,401 | $121,410 | $56,050 | $65,360 |
| 2024 | $8,401 | $118,550 | $50,450 | $68,100 |
| 2023 | $8,390 | $118,550 | $50,450 | $68,100 |
| 2022 | $8,186 | $107,770 | $44,840 | $62,930 |
| 2021 | $8,102 | $107,770 | $44,840 | $62,930 |
| 2020 | $7,595 | $98,410 | $52,540 | $45,870 |
| 2019 | $7,522 | $98,410 | $52,540 | $45,870 |
| 2018 | $7,007 | $84,740 | $34,430 | $50,310 |
| 2017 | $7,021 | $84,740 | $34,430 | $50,310 |
| 2016 | $7,236 | $83,620 | $30,630 | $52,990 |
| 2015 | $7,268 | $83,620 | $30,630 | $52,990 |
| 2014 | $6,642 | $75,070 | $22,630 | $52,440 |
Source: Public Records
Map
Nearby Homes
- 546 Donne Ave
- 7484 Gannon Ave
- 515 N Bemiston Ave
- 7510 Teasdale Ave
- 7584 Amherst Ave
- 500 N and Rd S Unit 103
- 7498 Teasdale Ave
- 7526 Washington Ave
- 7814 Gannon Ave
- 516 Warder Ave
- 7459 Washington Ave
- 7634 Balson Ave
- 7445 Teasdale Ave
- 7818 Stanford Ave
- 7484 Stratford Ave
- 7835 Delmar Blvd Unit 1E, 1W, 2E, 2W
- 7432 Delmar Blvd
- 224 N Bemiston Ave
- 7843 Cornell Ave
- 7400 Gannon Ave
- 7611 Gannon Ave
- 7608 Cornell Ave
- 7600 Cornell Ave
- 7612 Cornell Ave
- 7616 Cornell Ave
- 7628 Gannon Ave
- 7630 Gannon Ave
- 7624 Gannon Ave
- 7620 Cornell Ave
- 7620 Gannon Ave
- 7616 Gannon Ave
- 7574 Cornell Ave
- 7624 Cornell Ave
- 706 N Bemiston Ave
- 7612 Gannon Ave
- 7559 Gannon Ave
- 7631 Delmar Blvd Unit 1W
- 7631 Delmar Blvd Unit 1E
- 7605 Cornell Ave
- 7609 Cornell Ave