Estimated Value: $257,000 - $304,000
3
Beds
2
Baths
1,805
Sq Ft
$152/Sq Ft
Est. Value
About This Home
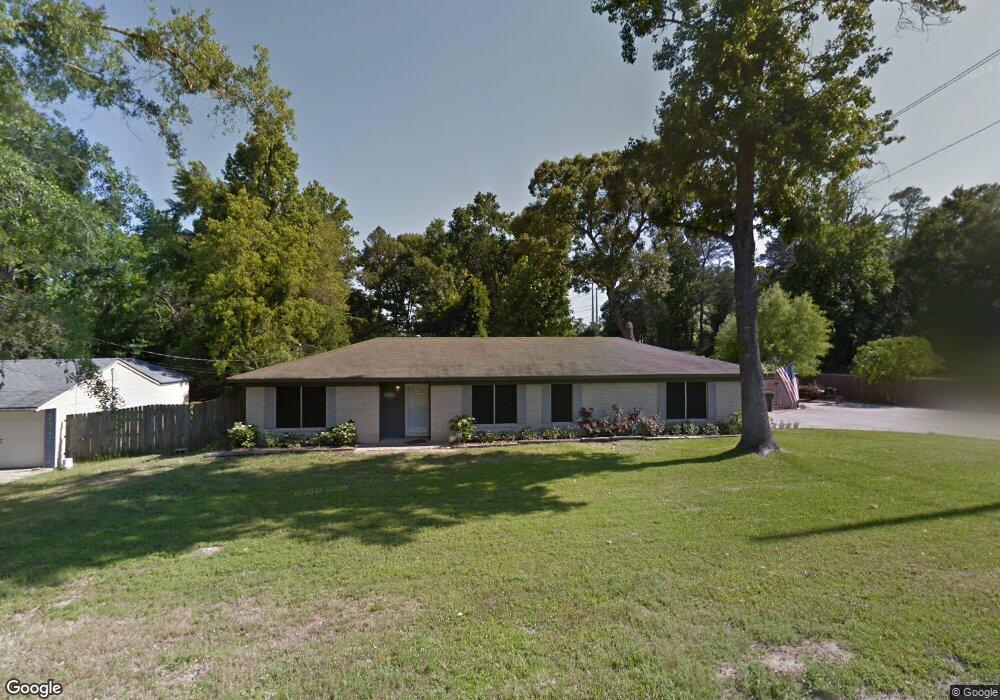
This home is located at 7618 7618 Brookhollow, Tyler, TX 75707 and is currently estimated at $274,063, approximately $151 per square foot. 7618 7618 Brookhollow is a home located in Smith County with nearby schools including H.L. Higgins Elementary School, J.W. Holloway Sixth Grade School, and Whitehouse High School.
Ownership History
Date
Name
Owned For
Owner Type
Purchase Details
Closed on
Aug 2, 2022
Sold by
Darius Wright
Bought by
Anderson Jerry R and Anderson Julia L
Current Estimated Value
Purchase Details
Closed on
Oct 15, 2015
Sold by
Wallace Hunter C and Wallace Kirby
Bought by
Wright Darius
Home Financials for this Owner
Home Financials are based on the most recent Mortgage that was taken out on this home.
Original Mortgage
$121,262
Interest Rate
4.12%
Mortgage Type
FHA
Purchase Details
Closed on
Sep 24, 2010
Sold by
Meshell Dennis and Meshell March
Bought by
Wallace Hunter C
Home Financials for this Owner
Home Financials are based on the most recent Mortgage that was taken out on this home.
Original Mortgage
$97,600
Interest Rate
4.48%
Mortgage Type
New Conventional
Create a Home Valuation Report for This Property
The Home Valuation Report is an in-depth analysis detailing your home's value as well as a comparison with similar homes in the area
Home Values in the Area
Average Home Value in this Area
Purchase History
| Date | Buyer | Sale Price | Title Company |
|---|---|---|---|
| Anderson Jerry R | -- | None Listed On Document | |
| Wright Darius | -- | Ctc | |
| Wallace Hunter C | -- | None Available | |
| Wallace Hunter C | -- | None Available |
Source: Public Records
Mortgage History
| Date | Status | Borrower | Loan Amount |
|---|---|---|---|
| Previous Owner | Wright Darius | $121,262 | |
| Previous Owner | Wallace Hunter C | $97,600 |
Source: Public Records
Tax History Compared to Growth
Tax History
| Year | Tax Paid | Tax Assessment Tax Assessment Total Assessment is a certain percentage of the fair market value that is determined by local assessors to be the total taxable value of land and additions on the property. | Land | Improvement |
|---|---|---|---|---|
| 2025 | $3,367 | $259,320 | $46,411 | $212,909 |
| 2024 | $3,367 | $247,681 | $32,424 | $218,874 |
| 2023 | $2,770 | $206,401 | $32,424 | $173,977 |
| 2022 | $2,574 | $166,802 | $24,457 | $142,345 |
| 2021 | $2,442 | $145,396 | $24,457 | $120,939 |
| 2020 | $2,334 | $132,992 | $24,457 | $108,535 |
| 2019 | $2,247 | $122,432 | $18,528 | $103,904 |
| 2018 | $2,181 | $119,340 | $18,528 | $100,812 |
| 2017 | $1,919 | $119,340 | $18,528 | $100,812 |
| 2016 | $1,900 | $118,202 | $18,528 | $99,674 |
| 2015 | $1,436 | $113,926 | $18,528 | $95,398 |
| 2014 | $1,436 | $108,873 | $18,528 | $90,345 |
Source: Public Records
Map
Nearby Homes
- 3123 Oak Bend
- 5832 Mustang Trail
- 5803 Persimmon Dr
- 3114 Arbor Oak Dr
- 5793 Palo Pinto Dr
- 5841 Havens Trail
- 5905 Havens Trail
- 6223 Mesquite Dr
- 5906 Mesquite Dr
- 5718 Gloucester Dr
- 6039 Pine Cone Ln
- 6015 Pine Cone Ln
- 5401 Andover Dr
- 3110 Tallow Oak Cir
- 6136 Graemont Blvd
- 5623 Berkeley Dr
- 5415 Andover Dr
- 5527 Andover Dr
- 3217 Libbie St
- 3139 Granbury Ct
- 7618 Brookhollow Dr
- 7668 Brookhollow Dr
- 7576 Brookhollow Dr
- 7683 Brookhollow Dr
- 7774 Brookhollow Dr
- 7743 Brookhollow Dr
- 7639 Brookhollow Dr
- 7518 Brookhollow Dr
- 7820 Brookhollow Dr
- 7809 Brookhollow Dr
- 7468 Brookhollow Dr
- 7869 Brookhollow Dr
- 7579 Brookhollow Dr
- 7888 Brookhollow Dr
- 7921 Brookhollow Dr
- 7503 Brookhollow Dr
- 7503 7503 Brookhollow Dr
- 7922 7922 Brookhollow Dr
- 7922 Brookhollow Dr
- 7434 Brookhollow Dr