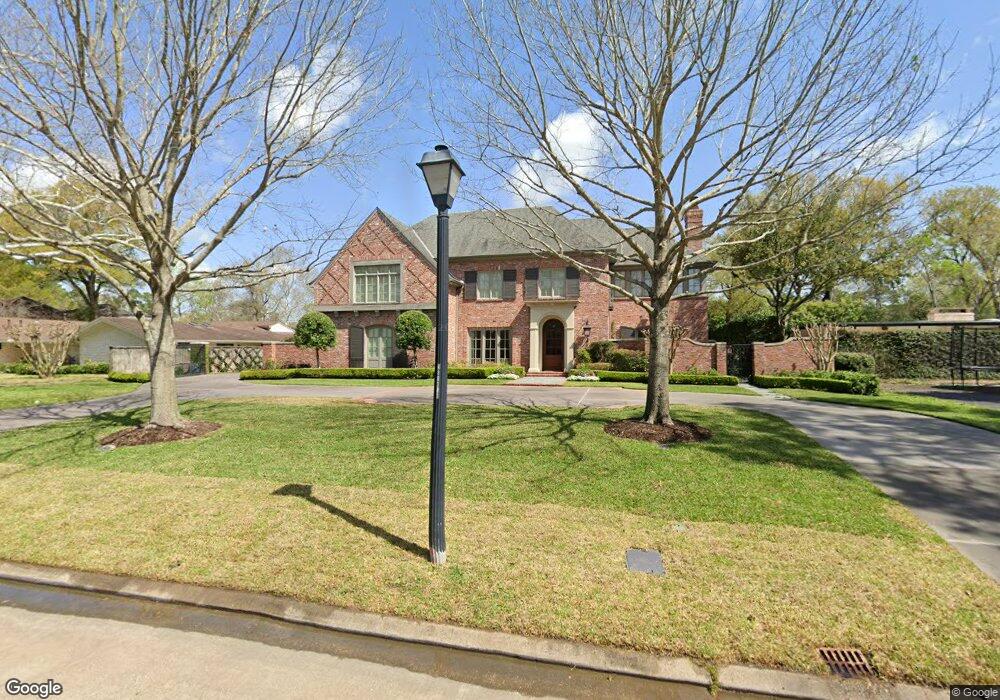
7618 River Point Dr Houston, TX 77063
Estimated Value: $2,278,000 - $3,923,409
4
Beds
6
Baths
6,484
Sq Ft
$478/Sq Ft
Est. Value
About This Home
This home is located at 7618 River Point Dr, Houston, TX 77063 and is currently estimated at $3,097,803, approximately $477 per square foot. 7618 River Point Dr is a home located in Harris County with nearby schools including Briargrove Elementary School, Tanglewood Middle, and Wisdom High School.
Ownership History
Date
Name
Owned For
Owner Type
Purchase Details
Closed on
Dec 20, 2018
Sold by
Risley Allyn W and Bogan Risley Tonya Jill
Bought by
Risley Allyn W and Bogan Risley Tonya Jill
Current Estimated Value
Purchase Details
Closed on
Sep 6, 2006
Sold by
Arendale Laura Wood and Hampton Laura W Arendale
Bought by
Risley Allyn Wayne and Risley Tonya Jill
Home Financials for this Owner
Home Financials are based on the most recent Mortgage that was taken out on this home.
Original Mortgage
$877,050
Outstanding Balance
$499,825
Interest Rate
5.75%
Mortgage Type
Purchase Money Mortgage
Estimated Equity
$2,597,978
Purchase Details
Closed on
Aug 30, 2006
Sold by
Kuni Douglas Wood
Bought by
Hampton Laura W Arendale and Arendale Laura Wood
Home Financials for this Owner
Home Financials are based on the most recent Mortgage that was taken out on this home.
Original Mortgage
$877,050
Outstanding Balance
$499,825
Interest Rate
5.75%
Mortgage Type
Purchase Money Mortgage
Estimated Equity
$2,597,978
Purchase Details
Closed on
Oct 1, 1997
Sold by
Arendale Bruce C and Whitten Myra Arendale
Bought by
Arendale Laura Wood
Create a Home Valuation Report for This Property
The Home Valuation Report is an in-depth analysis detailing your home's value as well as a comparison with similar homes in the area
Home Values in the Area
Average Home Value in this Area
Purchase History
| Date | Buyer | Sale Price | Title Company |
|---|---|---|---|
| Risley Allyn W | -- | None Available | |
| Risley Allyn Wayne | -- | Charter Title Company | |
| Hampton Laura W Arendale | -- | Charter Title Company | |
| Arendale Laura Wood | -- | Charter Title Company | |
| Arendale Laura Wood | -- | -- |
Source: Public Records
Mortgage History
| Date | Status | Borrower | Loan Amount |
|---|---|---|---|
| Open | Risley Allyn Wayne | $877,050 |
Source: Public Records
Tax History Compared to Growth
Tax History
| Year | Tax Paid | Tax Assessment Tax Assessment Total Assessment is a certain percentage of the fair market value that is determined by local assessors to be the total taxable value of land and additions on the property. | Land | Improvement |
|---|---|---|---|---|
| 2025 | $36,645 | $3,343,325 | $1,457,255 | $1,886,070 |
| 2024 | $36,645 | $2,940,000 | $1,315,578 | $1,624,422 |
| 2023 | $36,645 | $2,700,000 | $1,113,181 | $1,586,819 |
| 2022 | $47,993 | $2,577,052 | $1,113,181 | $1,463,871 |
| 2021 | $52,020 | $2,635,364 | $997,687 | $1,637,677 |
| 2020 | $55,289 | $2,700,000 | $997,687 | $1,702,313 |
| 2019 | $53,596 | $2,520,712 | $867,277 | $1,653,435 |
| 2018 | $35,174 | $2,352,900 | $910,785 | $1,442,115 |
| 2017 | $59,913 | $2,817,805 | $910,785 | $1,907,020 |
| 2016 | $58,109 | $2,817,805 | $910,785 | $1,907,020 |
| 2015 | $39,266 | $2,548,127 | $910,785 | $1,637,342 |
| 2014 | $39,266 | $2,435,324 | $910,785 | $1,524,539 |
Source: Public Records
Map
Nearby Homes
- 1010 River Bend Dr
- 11 River Cir
- 1119 River Glynn Dr
- 1006 River Glynn Dr
- 918 Huntington Cove
- 11095 Memorial Dr
- 7508 Creekwood Dr
- 6325 Riverview Way Unit ABCD
- 821 S Ripple Creek Dr Unit 1
- 205 Fleetway Dr
- 6401 Bayou Glen Rd
- 1229 Ripple Creek Dr
- 674 S Ripple Creek Dr Unit 674
- 6311 Riverview Way
- 6338 Crab Orchard Rd
- 6304 Riverview Way
- 6326 Crab Orchard Rd
- 220 Merrie Way Ln
- 630 S Ripple Creek Dr Unit 631
- 642 S Ripple Creek Dr Unit 642
- 7622 River Point Dr
- 7614 River Point Dr
- 7619 River Point Dr
- 7606 River Point Dr
- 7626 River Point Dr
- 7615 River Point Dr
- 7611 River Point Dr
- 7623 River Point Dr
- 1106 River Bend Dr
- 1110 River Bend Dr
- 7630 River Point Dr
- 7607 River Point Dr
- 7627 River Point Dr
- 7631 River Point Dr
- 1102 River Bend Dr
- 1102 River Bend Dr
- 7603 River Point Dr
- 1014 River Bend Dr
- 1118 River Bend Dr
- 1118 River Bend Dr