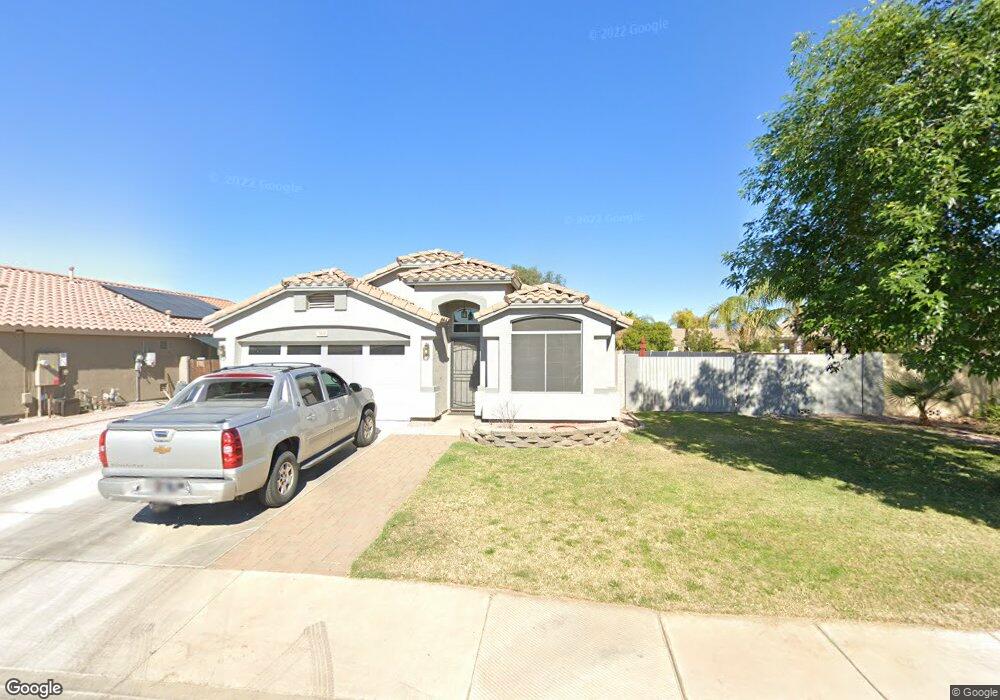
7618 W Nicolet Ave Glendale, AZ 85303
Estimated Value: $394,813 - $450,000
--
Bed
2
Baths
1,855
Sq Ft
$229/Sq Ft
Est. Value
About This Home
This home is located at 7618 W Nicolet Ave, Glendale, AZ 85303 and is currently estimated at $423,953, approximately $228 per square foot. 7618 W Nicolet Ave is a home located in Maricopa County with nearby schools including Sunset Vista and Independence High School.
Ownership History
Date
Name
Owned For
Owner Type
Purchase Details
Closed on
Sep 20, 2005
Sold by
Hirning Jodi L
Bought by
Nelch Charles F and Hirning Jodi L
Current Estimated Value
Home Financials for this Owner
Home Financials are based on the most recent Mortgage that was taken out on this home.
Original Mortgage
$50,000
Outstanding Balance
$26,683
Interest Rate
5.81%
Mortgage Type
New Conventional
Estimated Equity
$397,270
Purchase Details
Closed on
Jul 23, 2005
Sold by
Nelch Charles F
Bought by
Hirning Jodi L
Home Financials for this Owner
Home Financials are based on the most recent Mortgage that was taken out on this home.
Original Mortgage
$50,000
Outstanding Balance
$26,683
Interest Rate
5.81%
Mortgage Type
New Conventional
Estimated Equity
$397,270
Purchase Details
Closed on
Nov 19, 2003
Sold by
First American Title Insurance Co
Bought by
Nelch Charles F
Home Financials for this Owner
Home Financials are based on the most recent Mortgage that was taken out on this home.
Original Mortgage
$157,172
Interest Rate
5.97%
Mortgage Type
FHA
Create a Home Valuation Report for This Property
The Home Valuation Report is an in-depth analysis detailing your home's value as well as a comparison with similar homes in the area
Home Values in the Area
Average Home Value in this Area
Purchase History
| Date | Buyer | Sale Price | Title Company |
|---|---|---|---|
| Nelch Charles F | -- | Lawyers Title Ins | |
| Hirning Jodi L | -- | -- | |
| Nelch Charles F | $162,253 | First American Title Ins Co |
Source: Public Records
Mortgage History
| Date | Status | Borrower | Loan Amount |
|---|---|---|---|
| Open | Nelch Charles F | $50,000 | |
| Previous Owner | Nelch Charles F | $157,172 |
Source: Public Records
Tax History Compared to Growth
Tax History
| Year | Tax Paid | Tax Assessment Tax Assessment Total Assessment is a certain percentage of the fair market value that is determined by local assessors to be the total taxable value of land and additions on the property. | Land | Improvement |
|---|---|---|---|---|
| 2025 | $1,881 | $15,898 | -- | -- |
| 2024 | $1,706 | $15,141 | -- | -- |
| 2023 | $1,706 | $32,610 | $6,520 | $26,090 |
| 2022 | $1,697 | $25,250 | $5,050 | $20,200 |
| 2021 | $1,689 | $23,400 | $4,680 | $18,720 |
| 2020 | $1,710 | $20,500 | $4,100 | $16,400 |
| 2019 | $1,692 | $18,350 | $3,670 | $14,680 |
| 2018 | $1,622 | $17,550 | $3,510 | $14,040 |
| 2017 | $1,646 | $15,570 | $3,110 | $12,460 |
| 2016 | $1,562 | $15,170 | $3,030 | $12,140 |
| 2015 | $1,473 | $14,810 | $2,960 | $11,850 |
Source: Public Records
Map
Nearby Homes
- 7425 N 75th Dr
- 7920 W Glendale Ave Unit 39
- 7920 W Glendale Ave Unit 65
- 7221 N 74th Ave
- 7403 W State Ave
- 7681 W Lamar Rd
- 7136 N 73rd Dr
- 8022 W Northview Ave
- 7338 N 80th Ln
- 7599 W Krall St
- 8024 W Vista Ave
- 8031 W Morten Ave
- 7846 W Ocotillo Rd
- 7258 W State Ave
- 6705 N 77th Dr
- 7253 W Aurelius Ave
- 7926 W Frier Dr
- 7222 N 72nd Ave
- 7317 W Lamar Rd Unit 1
- 7214 W Vista Ave
- 7624 W Nicolet Ave
- 7612 W Nicolet Ave
- 7625 W Northview Ave
- 7619 W Northview Ave
- 7617 W Nicolet Ave
- 7611 W Nicolet Ave Unit 70
- 7623 W Nicolet Ave
- 7613 W Northview Ave
- 7605 W Nicolet Ave
- 7302 N 76th Dr
- 7600 W Nicolet Ave
- 7599 W Nicolet Ave
- 7308 N 76th Dr
- 7629 W Nicolet Ave
- 7607 W Northview Ave
- 7314 N 76th Dr
- 7593 W Nicolet Ave
- 7635 W Nicolet Ave
- 7594 W Nicolet Ave
- 7601 W Northview Ave Unit 113