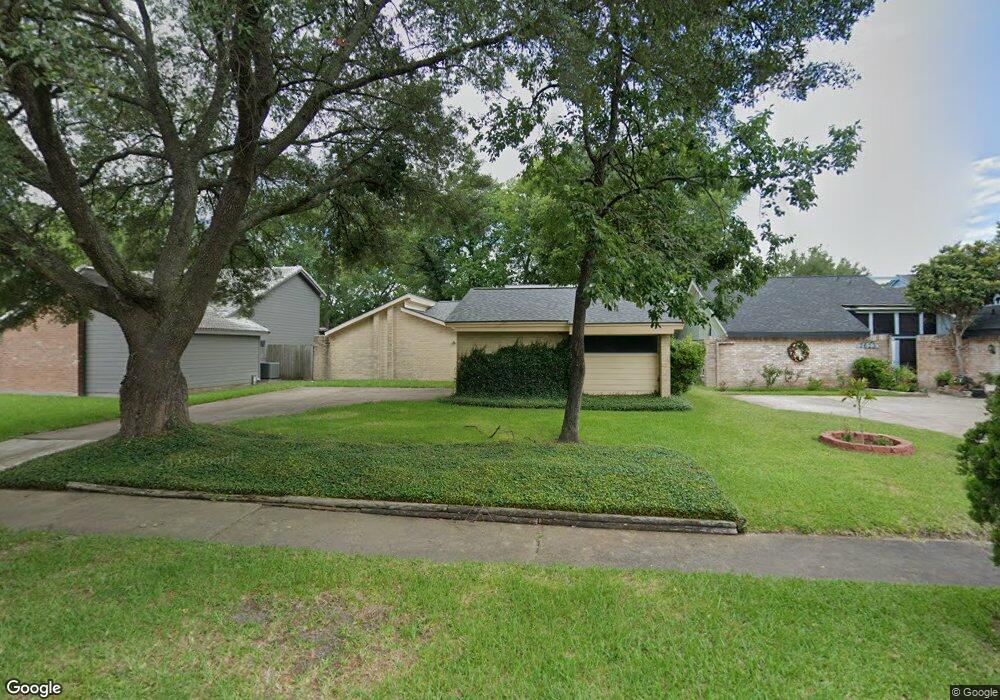
7619 Athlone Dr Houston, TX 77088
Greater Inwood NeighborhoodEstimated Value: $226,000 - $241,000
3
Beds
2
Baths
1,446
Sq Ft
$161/Sq Ft
Est. Value
About This Home
This home is located at 7619 Athlone Dr, Houston, TX 77088 and is currently estimated at $232,177, approximately $160 per square foot. 7619 Athlone Dr is a home located in Harris County with nearby schools including Stovall School, Caraway Intermediate School, and Caraway Elementary School.
Ownership History
Date
Name
Owned For
Owner Type
Purchase Details
Closed on
Jun 8, 2017
Sold by
Olivares Willie
Bought by
Hakim Leeann and Hakim Tahr Zagham
Current Estimated Value
Home Financials for this Owner
Home Financials are based on the most recent Mortgage that was taken out on this home.
Original Mortgage
$127,546
Outstanding Balance
$107,177
Interest Rate
4.4%
Mortgage Type
FHA
Estimated Equity
$125,000
Purchase Details
Closed on
Dec 16, 2011
Sold by
Binz Paul and Binz Wilma
Bought by
Olivares Willie
Home Financials for this Owner
Home Financials are based on the most recent Mortgage that was taken out on this home.
Original Mortgage
$87,718
Interest Rate
4.75%
Mortgage Type
FHA
Purchase Details
Closed on
Feb 1, 2011
Sold by
Wen Allison and Wen Cassandra
Bought by
Binz Paul and Binz Wilma
Create a Home Valuation Report for This Property
The Home Valuation Report is an in-depth analysis detailing your home's value as well as a comparison with similar homes in the area
Home Values in the Area
Average Home Value in this Area
Purchase History
| Date | Buyer | Sale Price | Title Company |
|---|---|---|---|
| Hakim Leeann | -- | American Title Co | |
| Olivares Willie | -- | American Title Company | |
| Binz Paul | -- | Stewart Title Fort Bend |
Source: Public Records
Mortgage History
| Date | Status | Borrower | Loan Amount |
|---|---|---|---|
| Open | Hakim Leeann | $127,546 | |
| Previous Owner | Olivares Willie | $87,718 |
Source: Public Records
Tax History Compared to Growth
Tax History
| Year | Tax Paid | Tax Assessment Tax Assessment Total Assessment is a certain percentage of the fair market value that is determined by local assessors to be the total taxable value of land and additions on the property. | Land | Improvement |
|---|---|---|---|---|
| 2025 | $3,771 | $246,533 | $51,180 | $195,353 |
| 2024 | $3,771 | $249,551 | $51,180 | $198,371 |
| 2023 | $3,771 | $277,201 | $51,180 | $226,021 |
| 2022 | $4,680 | $237,757 | $42,948 | $194,809 |
| 2021 | $4,455 | $193,430 | $35,790 | $157,640 |
| 2020 | $4,256 | $177,289 | $35,790 | $141,499 |
| 2019 | $4,056 | $146,593 | $18,611 | $127,982 |
| 2018 | $1,564 | $133,915 | $18,611 | $115,304 |
| 2017 | $3,020 | $133,915 | $18,611 | $115,304 |
| 2016 | $2,746 | $133,915 | $18,611 | $115,304 |
| 2015 | $1,861 | $113,861 | $18,611 | $95,250 |
| 2014 | $1,861 | $95,217 | $18,611 | $76,606 |
Source: Public Records
Map
Nearby Homes
- 7611 Athlone Dr
- 7707 Inwood Grove Ln
- 7718 Inwood Grove Ln
- 7705 Inwood Grove Ln
- 7808 Inwood Grove Ln
- 7716 Inwood Grove Ln
- 7712 Inwood Grove Ln
- 7814 Inwood Grove Ln
- 7717 Inwood Hills Ln
- 7709 Inwood Hills Ln
- DOVE Plan at Alaia Crossing
- CEDAR Plan at Alaia Crossing
- BOXWOOD Plan at Alaia Crossing
- 7816 Inwood Grove Ln
- 7702 Inwood Hills Ln
- 4206 Saratoga Dr
- 4306 Saratoga Dr
- 3718 Storm Creek Dr
- 7610 Alperton Dr
- 4015 Black Locust Dr
- 7623 Athlone Dr
- 7615 Athlone Dr
- 7627 Athlone Dr
- 3918 Almington Ln
- 7607 Athlone Dr
- 3915 Sardis Ln
- 3919 Almington Ln
- 3914 Almington Ln
- 7631 Athlone Dr
- 4010 Mayfield Oaks Ln
- 3911 Sardis Ln
- 7603 Athlone Dr
- 4010 R V Mayfield Dr
- 3915 Almington Ln
- 4014 Mayfield Oaks Ln
- 3910 Almington Ln
- 4014 R V Mayfield Dr
- 3918 R V Mayfield Dr
- 3918 Mayfield Oaks Ln
- 3914 Sardis Ln