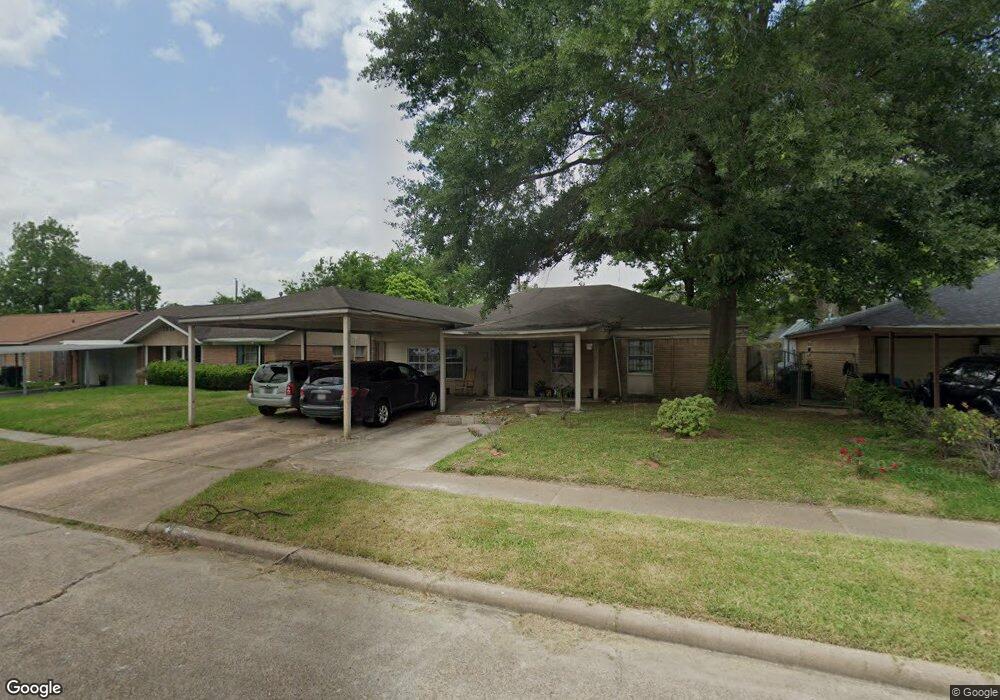
7619 Sterlingshire St Houston, TX 77016
East Little York NeighborhoodEstimated Value: $203,770 - $253,000
4
Beds
2
Baths
2,208
Sq Ft
$103/Sq Ft
Est. Value
About This Home
This home is located at 7619 Sterlingshire St, Houston, TX 77016 and is currently estimated at $228,443, approximately $103 per square foot. 7619 Sterlingshire St is a home located in Harris County with nearby schools including Shadydale Elementary School, Forest Brook Middle, and North Forest High School.
Ownership History
Date
Name
Owned For
Owner Type
Purchase Details
Closed on
Dec 6, 2007
Sold by
Us Bank Na
Bought by
Summey Lance
Current Estimated Value
Home Financials for this Owner
Home Financials are based on the most recent Mortgage that was taken out on this home.
Original Mortgage
$84,800
Interest Rate
6.3%
Mortgage Type
Purchase Money Mortgage
Purchase Details
Closed on
Aug 7, 2007
Sold by
Joubert Mary F
Bought by
Us Bank Na and Finance America Mortgage Loan Tr 2004-1
Purchase Details
Closed on
Feb 13, 1996
Sold by
Woodbriar Investments Ltd
Bought by
Joubert Francis D and Joubert Mary F
Home Financials for this Owner
Home Financials are based on the most recent Mortgage that was taken out on this home.
Original Mortgage
$44,000
Interest Rate
7.04%
Purchase Details
Closed on
Aug 4, 1994
Sold by
Davis Dorothy Mae and Bullock Dorothy
Bought by
Woodbriar Investments Ltd
Create a Home Valuation Report for This Property
The Home Valuation Report is an in-depth analysis detailing your home's value as well as a comparison with similar homes in the area
Home Values in the Area
Average Home Value in this Area
Purchase History
| Date | Buyer | Sale Price | Title Company |
|---|---|---|---|
| Summey Lance | -- | First American Title | |
| Us Bank Na | $60,187 | None Available | |
| Joubert Francis D | -- | Regency Title Co | |
| Woodbriar Investments Ltd | -- | Texas American Title Company |
Source: Public Records
Mortgage History
| Date | Status | Borrower | Loan Amount |
|---|---|---|---|
| Closed | Summey Lance | $84,800 | |
| Previous Owner | Joubert Francis D | $44,000 |
Source: Public Records
Tax History Compared to Growth
Tax History
| Year | Tax Paid | Tax Assessment Tax Assessment Total Assessment is a certain percentage of the fair market value that is determined by local assessors to be the total taxable value of land and additions on the property. | Land | Improvement |
|---|---|---|---|---|
| 2025 | $4,101 | $196,014 | $45,150 | $150,864 |
| 2024 | $4,101 | $196,014 | $45,150 | $150,864 |
| 2023 | $4,101 | $248,086 | $45,150 | $202,936 |
| 2022 | $4,658 | $211,548 | $37,926 | $173,622 |
| 2021 | $3,989 | $171,150 | $25,284 | $145,866 |
| 2020 | $3,671 | $151,575 | $18,782 | $132,793 |
| 2019 | $3,679 | $145,383 | $13,726 | $131,657 |
| 2018 | $2,366 | $93,500 | $12,353 | $81,147 |
| 2017 | $2,364 | $93,500 | $12,353 | $81,147 |
| 2016 | $2,211 | $87,453 | $12,353 | $75,100 |
| 2015 | $1,219 | $78,463 | $12,353 | $66,110 |
| 2014 | $1,219 | $47,428 | $12,353 | $35,075 |
Source: Public Records
Map
Nearby Homes
- 7611 Cabot St
- 7603 Caddo Rd
- 7639 Bigwood St
- 0 Wileyvale Rd Unit 37533417
- 0 Laura Koppe Rd Unit 64066450
- 0 Lockwood Unit 97801497
- 0 Wileyvale Rd Unit 98938709
- 10101 Rebel Rd
- 7717 Bigwood St
- 10106 Cheeves Dr
- 7338 Bigwood St
- 7314 Sterlingshire St
- 10125 Rebel Rd
- 7402 Yoe St
- 0 Bretshire Dr Unit 83088734
- 0 Bretshire Dr Unit 61965426
- 8022 Yoe St
- 7305 Yoe St
- 7306 Parker Rd
- 7242 Bretshire Dr
- 7615 Sterlingshire St
- 7623 Sterlingshire St
- 7618 Bigwood St
- 7611 Sterlingshire St
- 7627 Sterlingshire St
- 7614 Bigwood St
- 7622 Bigwood St
- 7610 Bigwood St
- 7626 Bigwood St
- 7618 Sterlingshire St
- 7631 Sterlingshire St
- 7607 Sterlingshire St
- 7622 Sterlingshire St
- 7614 Sterlingshire St
- 7626 Sterlingshire St
- 7610 Sterlingshire St
- 7606 Bigwood St
- 7630 Bigwood St
- 7635 Sterlingshire St
- 7603 Sterlingshire St