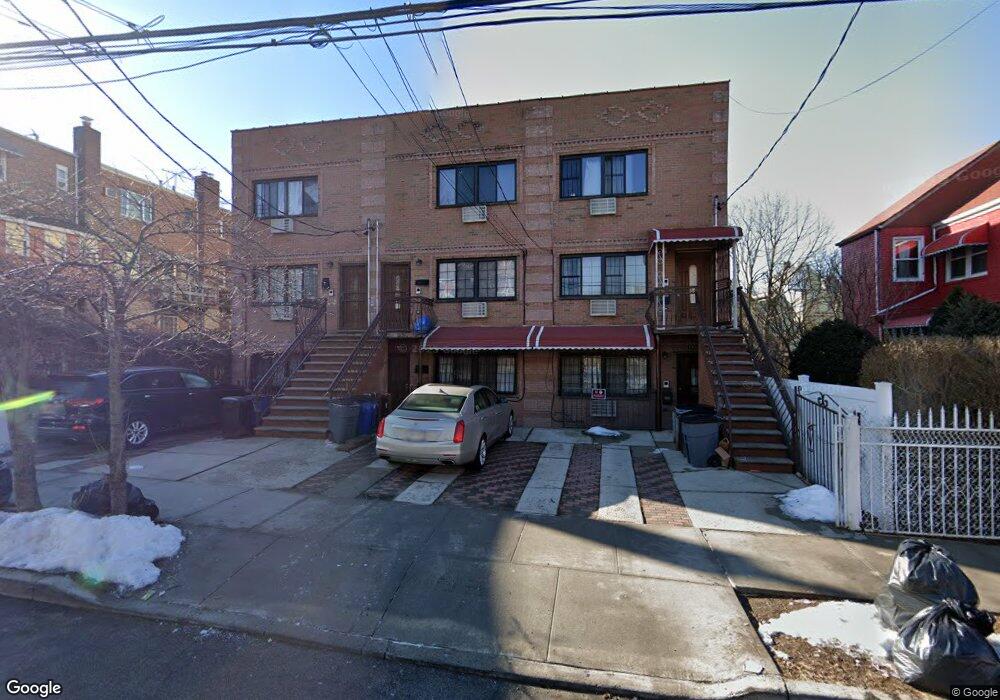
762 E 218th St Bronx, NY 10467
Williamsbridge NeighborhoodEstimated Value: $875,223 - $1,048,000
Studio
--
Bath
3,084
Sq Ft
$314/Sq Ft
Est. Value
About This Home
This home is located at 762 E 218th St, Bronx, NY 10467 and is currently estimated at $969,806, approximately $314 per square foot. 762 E 218th St is a home located in Bronx County with nearby schools including Ps 21 Philip H Sheridan, North Bronx School of Empowerment, and Bronx Charter School For Excellence 3.
Ownership History
Date
Name
Owned For
Owner Type
Purchase Details
Closed on
Mar 16, 2023
Sold by
Amoako Agyemang
Bought by
Agyemang Linda Arthur
Current Estimated Value
Purchase Details
Closed on
Feb 23, 2022
Sold by
Appiah Joseph
Bought by
Agyemang Amoako and Agyemang Linda Arthur
Home Financials for this Owner
Home Financials are based on the most recent Mortgage that was taken out on this home.
Original Mortgage
$598,500
Outstanding Balance
$558,189
Interest Rate
3.92%
Mortgage Type
Purchase Money Mortgage
Estimated Equity
$411,617
Purchase Details
Closed on
Sep 6, 2016
Sold by
Appiah Joseph and Bekoe Jacqueline
Bought by
Appiah Joseph
Purchase Details
Closed on
Feb 19, 2010
Sold by
Tevet Assets Inc
Bought by
Appiah Joseph and Bekoe Jacqueline
Home Financials for this Owner
Home Financials are based on the most recent Mortgage that was taken out on this home.
Original Mortgage
$500,762
Interest Rate
5%
Mortgage Type
Purchase Money Mortgage
Purchase Details
Closed on
Feb 17, 2009
Sold by
Belotti Georgia and Giuliano Eugenia
Bought by
Tevet Assets Inc
Create a Home Valuation Report for This Property
The Home Valuation Report is an in-depth analysis detailing your home's value as well as a comparison with similar homes in the area
Home Values in the Area
Average Home Value in this Area
Purchase History
| Date | Buyer | Sale Price | Title Company |
|---|---|---|---|
| Agyemang Linda Arthur | $1,000 | -- | |
| Agyemang Amoako | -- | -- | |
| Appiah Joseph | -- | -- | |
| Appiah Joseph | $510,000 | -- | |
| Tevet Assets Inc | $320,000 | -- |
Source: Public Records
Mortgage History
| Date | Status | Borrower | Loan Amount |
|---|---|---|---|
| Open | Agyemang Amoako | $598,500 | |
| Previous Owner | Appiah Joseph | $500,762 |
Source: Public Records
Tax History
| Year | Tax Paid | Tax Assessment Tax Assessment Total Assessment is a certain percentage of the fair market value that is determined by local assessors to be the total taxable value of land and additions on the property. | Land | Improvement |
|---|---|---|---|---|
| 2025 | $8,295 | $43,776 | $3,888 | $39,888 |
| 2024 | $8,295 | $41,299 | $3,767 | $37,532 |
| 2023 | $8,387 | $41,299 | $4,356 | $36,943 |
| 2022 | $7,805 | $49,500 | $4,860 | $44,640 |
| 2021 | $8,138 | $40,800 | $4,860 | $35,940 |
| 2020 | $7,722 | $40,080 | $4,860 | $35,220 |
| 2019 | $7,200 | $41,280 | $4,860 | $36,420 |
| 2018 | $7,016 | $34,416 | $4,782 | $29,634 |
| 2017 | $6,641 | $32,580 | $4,860 | $27,720 |
| 2016 | $6,442 | $32,224 | $4,085 | $28,139 |
| 2015 | $4,547 | $30,400 | $5,152 | $25,248 |
| 2014 | $4,547 | $28,680 | $5,400 | $23,280 |
Source: Public Records
Map
Nearby Homes
- 3763 Barnes Ave
- 740 E 218th St
- 738 E 219th St
- 760 E 221st St
- 762 E 221st St
- 724 E 216th St Unit 5C
- 724 E 216th St Unit 2C
- 804 E 221st St
- 686 E 220th St
- 826 E 216th St
- 836 E 221st St
- 831 E 221st St
- 835 E 221st St
- 3717 Bronxwood Ave
- 822 E 215th St
- 849 E 221st St
- 3631 Barnes Ave
- 855 E 215th St
- 679 E 221st St
- 3800 Bronxwood Ave
- 762 E 218th St
- 760 E 218th St
- 764 E 218th St
- 758 E 218th St
- 3741 Barnes Ave
- 3743 Barnes Ave
- 3745 Barnes Ave
- 3737 Barnes Ave
- 756 E 218th St
- 3735 Barnes Ave
- 765 E 217th St
- 765 E 217 St
- 3733 Barnes Ave
- 763 E 217th St
- 759 E 217th St
- 750 E 218th St
- 769 E 217th St
- 3729 Barnes Ave
- 769 E 218th St
- 3751 Barnes Ave
Your Personal Tour Guide
Ask me questions while you tour the home.