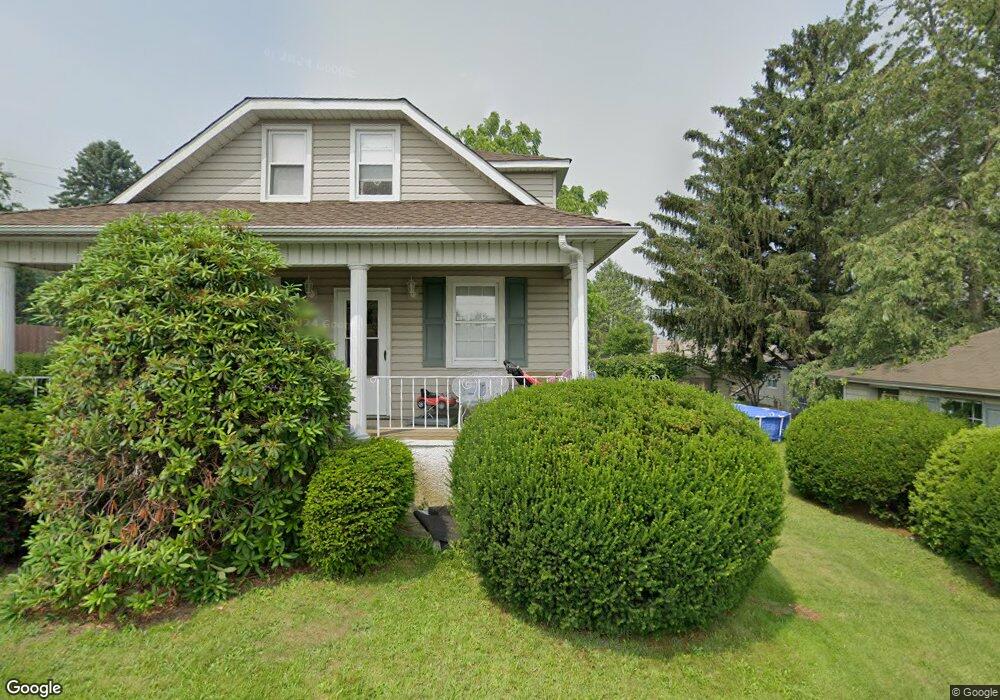
762 Wilbur Ct Hazleton, PA 18201
Estimated Value: $164,150 - $208,000
--
Bed
--
Bath
832
Sq Ft
$219/Sq Ft
Est. Value
About This Home
This home is located at 762 Wilbur Ct, Hazleton, PA 18201 and is currently estimated at $182,038, approximately $218 per square foot. 762 Wilbur Ct is a home with nearby schools including Hazleton Area High School, Immanuel Christian School, and Bishop Hafey Junior/Senior High School.
Ownership History
Date
Name
Owned For
Owner Type
Purchase Details
Closed on
Aug 4, 2023
Sold by
Ramirez Sandra V
Bought by
Grullon Evelio Antonio
Current Estimated Value
Home Financials for this Owner
Home Financials are based on the most recent Mortgage that was taken out on this home.
Original Mortgage
$147,283
Outstanding Balance
$142,126
Interest Rate
6.67%
Mortgage Type
FHA
Estimated Equity
$39,912
Purchase Details
Closed on
May 7, 2015
Sold by
Sedon Christopher Z and Sedon Stephan Eric
Bought by
Ramirez Sandra V
Purchase Details
Closed on
Jan 16, 1991
Bought by
Sedon William
Create a Home Valuation Report for This Property
The Home Valuation Report is an in-depth analysis detailing your home's value as well as a comparison with similar homes in the area
Home Values in the Area
Average Home Value in this Area
Purchase History
| Date | Buyer | Sale Price | Title Company |
|---|---|---|---|
| Grullon Evelio Antonio | $150,000 | None Listed On Document | |
| Ramirez Sandra V | $42,000 | None Available | |
| Sedon William | -- | -- |
Source: Public Records
Mortgage History
| Date | Status | Borrower | Loan Amount |
|---|---|---|---|
| Open | Grullon Evelio Antonio | $147,283 |
Source: Public Records
Tax History Compared to Growth
Tax History
| Year | Tax Paid | Tax Assessment Tax Assessment Total Assessment is a certain percentage of the fair market value that is determined by local assessors to be the total taxable value of land and additions on the property. | Land | Improvement |
|---|---|---|---|---|
| 2025 | $1,844 | $64,200 | $25,000 | $39,200 |
| 2024 | $1,728 | $64,200 | $25,000 | $39,200 |
| 2023 | $1,615 | $64,200 | $25,000 | $39,200 |
| 2022 | $1,603 | $64,200 | $25,000 | $39,200 |
| 2021 | $1,566 | $64,200 | $25,000 | $39,200 |
| 2020 | $1,399 | $64,200 | $25,000 | $39,200 |
| 2019 | $1,444 | $64,200 | $25,000 | $39,200 |
| 2018 | $1,395 | $64,200 | $25,000 | $39,200 |
| 2017 | $1,286 | $64,200 | $25,000 | $39,200 |
| 2016 | $914 | $64,200 | $25,000 | $39,200 |
| 2015 | -- | $107,100 | $30,500 | $76,600 |
| 2014 | -- | $107,100 | $30,500 | $76,600 |
Source: Public Records
Map
Nearby Homes
- 756 Peace St
- 667 Roosevelt St
- 60 E Jefferson Ave
- 782 N James St
- 590 Mckinley St
- 118 E Green St
- 124 Putnam St
- 882 N Locust St
- 714 Alter St
- 1 W Diamond Ave
- 522 N James St
- 609 Landmesser Ave
- 1009 Peace St
- 1087 N Rear Locust St
- 9 Park St
- 111 S Broad St
- 827 N Vine St
- 572 N Vine St
- 31 Park St
- 739 N Church St