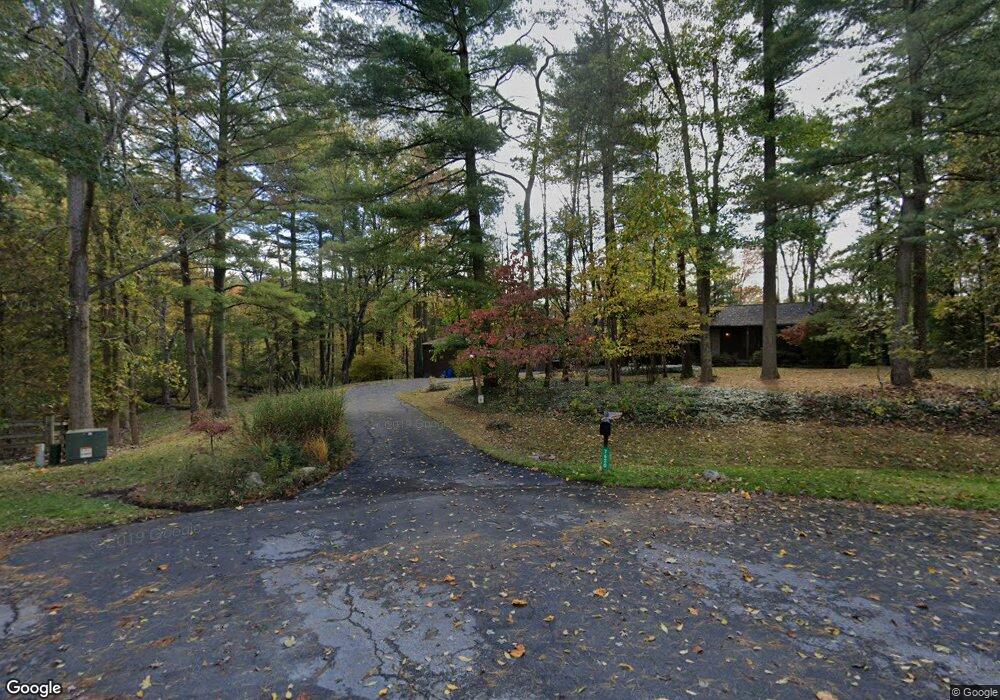
7620 Dusty Pines Dr Galena, OH 43021
Estimated Value: $530,617 - $586,000
3
Beds
2
Baths
2,284
Sq Ft
$242/Sq Ft
Est. Value
About This Home
This home is located at 7620 Dusty Pines Dr, Galena, OH 43021 and is currently estimated at $552,154, approximately $241 per square foot. 7620 Dusty Pines Dr is a home located in Delaware County with nearby schools including Big Walnut Elementary School, Big Walnut Intermediate School, and Big Walnut Middle School.
Ownership History
Date
Name
Owned For
Owner Type
Purchase Details
Closed on
May 3, 2017
Sold by
Peth Susan M
Bought by
Peth Conor M
Current Estimated Value
Purchase Details
Closed on
Oct 12, 2013
Sold by
Peth Susan M and Peth Conor M
Bought by
Peth Conor M and Peth Susan M
Purchase Details
Closed on
Jun 12, 2009
Sold by
Kaiser Dirk and Kaiser Maureen
Bought by
Brown Susan M and Peth Conor M
Home Financials for this Owner
Home Financials are based on the most recent Mortgage that was taken out on this home.
Original Mortgage
$237,616
Interest Rate
5.27%
Mortgage Type
FHA
Purchase Details
Closed on
Oct 22, 1999
Sold by
Blessing Eileen R
Bought by
Kaiser Dirk and Kaiser Maureen
Home Financials for this Owner
Home Financials are based on the most recent Mortgage that was taken out on this home.
Original Mortgage
$141,600
Interest Rate
7.91%
Mortgage Type
New Conventional
Create a Home Valuation Report for This Property
The Home Valuation Report is an in-depth analysis detailing your home's value as well as a comparison with similar homes in the area
Home Values in the Area
Average Home Value in this Area
Purchase History
| Date | Buyer | Sale Price | Title Company |
|---|---|---|---|
| Peth Conor M | -- | None Available | |
| Peth Conor M | -- | Performance Title | |
| Brown Susan M | $242,000 | Stewart Title Oh | |
| Kaiser Dirk | $177,000 | -- |
Source: Public Records
Mortgage History
| Date | Status | Borrower | Loan Amount |
|---|---|---|---|
| Previous Owner | Brown Susan M | $237,616 | |
| Previous Owner | Kaiser Dirk | $141,600 |
Source: Public Records
Tax History Compared to Growth
Tax History
| Year | Tax Paid | Tax Assessment Tax Assessment Total Assessment is a certain percentage of the fair market value that is determined by local assessors to be the total taxable value of land and additions on the property. | Land | Improvement |
|---|---|---|---|---|
| 2024 | $6,337 | $141,610 | $56,770 | $84,840 |
| 2023 | $6,245 | $141,610 | $56,770 | $84,840 |
| 2022 | $5,209 | $101,190 | $35,490 | $65,700 |
| 2021 | $4,577 | $101,190 | $35,490 | $65,700 |
| 2020 | $5,247 | $101,190 | $35,490 | $65,700 |
| 2019 | $4,759 | $87,990 | $30,870 | $57,120 |
| 2018 | $4,426 | $87,990 | $30,870 | $57,120 |
| 2017 | $4,038 | $82,080 | $23,770 | $58,310 |
| 2016 | $3,887 | $82,080 | $23,770 | $58,310 |
| 2015 | $3,906 | $82,080 | $23,770 | $58,310 |
| 2014 | $3,896 | $82,080 | $23,770 | $58,310 |
| 2013 | $4,014 | $79,840 | $23,770 | $56,070 |
Source: Public Records
Map
Nearby Homes
- 7441 Lewis Center Rd
- 3903 Shagbark Trail
- 7454 Paradisio Dr
- 7912 Mariposa Dr
- 3222 Ryan Meadow Place
- 8216 W Shore Dr
- 6428 Fox Hollow Dr
- 5188 Blessing Ct
- 1528 State Route 3 S
- 265 Hawking Dr
- 6152 Jaycox Rd
- 5015 Bespoke Ct
- 6401 Big Walnut Rd
- 5279 Slater Ridge
- 5349 Slater Ridge Unit 5349
- 6398 Garden Loop
- 6384 Garden Loop
- 6178 Garden
- 6192 Garden Loop
- 6206 Garden Loop
- 7590 Dusty Pines Dr
- 7599 Dusty Pines Dr
- 3995 Treeline Dr
- 7567 Dusty Pines Dr
- 7530 Dusty Pines Dr
- 4011 Treeline Dr
- 4011 Treeline Ct
- 7529 Dusty Pines Dr
- 3998 Treeline Ct
- 3988 Treeline Dr
- 3988 Treeline Ct
- 4027 Treeline Dr
- 7520 Dusty Pines Dr
- 4027 Treeline Ct
- 3788 Worthington Rd
- 4000 Treeline Dr
- 4020 Treeline Dr
- 4020 Treeline Ct
- 3985 Worthington Rd
- 4051 Treeline Dr