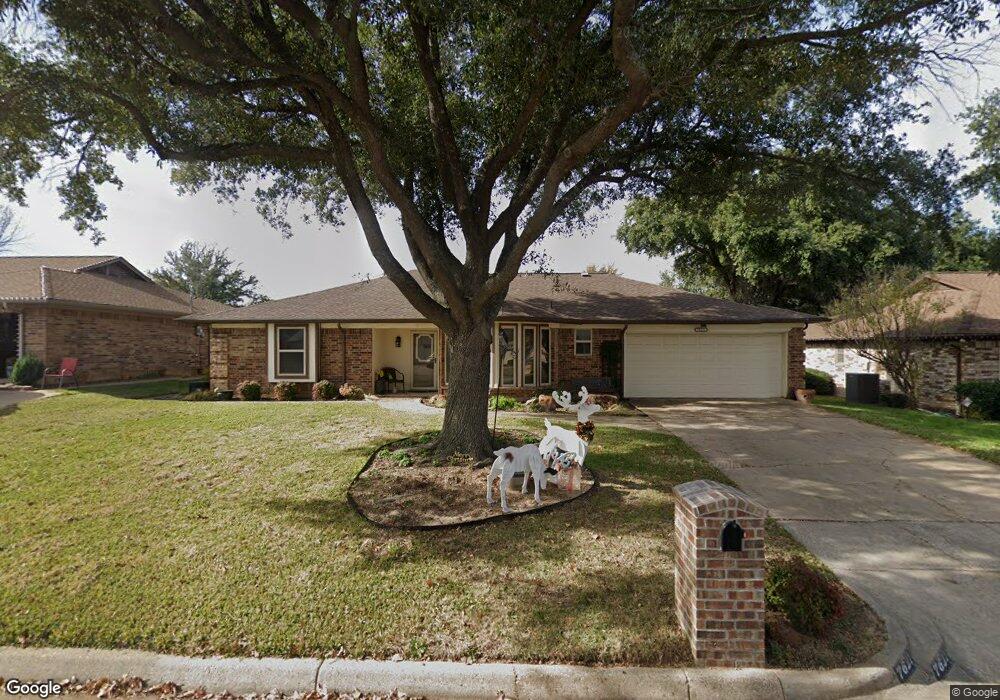
7621 Hunt Dr North Richland Hills, TX 76182
Estimated Value: $406,043 - $461,000
3
Beds
2
Baths
2,170
Sq Ft
$202/Sq Ft
Est. Value
About This Home
This home is located at 7621 Hunt Dr, North Richland Hills, TX 76182 and is currently estimated at $439,261, approximately $202 per square foot. 7621 Hunt Dr is a home located in Tarrant County with nearby schools including Smithfield Elementary School, Smithfield Middle School, and Birdville High School.
Ownership History
Date
Name
Owned For
Owner Type
Purchase Details
Closed on
May 30, 2013
Sold by
Yuchnovicz Barbara I
Bought by
Hader Michael K and Hader Karen
Current Estimated Value
Purchase Details
Closed on
Apr 21, 2005
Sold by
The Yuchnovicz Revocable Living Trust
Bought by
Yuchnovicz Stanley H and Yuchnovicz Barbara I
Home Financials for this Owner
Home Financials are based on the most recent Mortgage that was taken out on this home.
Original Mortgage
$252,750
Interest Rate
4.82%
Mortgage Type
FHA
Purchase Details
Closed on
Apr 17, 2000
Sold by
Yuchnovicz Stanley H and Yuchnovicz Barbara I
Bought by
Yuchnovicz Stanley H and Yuchnovicz Barbara I
Purchase Details
Closed on
May 18, 1994
Sold by
Forester Anita Myrine
Bought by
Yuchnovicz Stan and Yuchnovicz Barbara I
Create a Home Valuation Report for This Property
The Home Valuation Report is an in-depth analysis detailing your home's value as well as a comparison with similar homes in the area
Home Values in the Area
Average Home Value in this Area
Purchase History
| Date | Buyer | Sale Price | Title Company |
|---|---|---|---|
| Hader Michael K | -- | None Available | |
| Yuchnovicz Stanley H | -- | -- | |
| Yuchnovicz Stanley H | -- | -- | |
| Yuchnovicz Stan | -- | First American Title Co |
Source: Public Records
Mortgage History
| Date | Status | Borrower | Loan Amount |
|---|---|---|---|
| Previous Owner | Yuchnovicz Stanley H | $252,750 | |
| Closed | Yuchnovicz Stanley H | $252,750 |
Source: Public Records
Tax History Compared to Growth
Tax History
| Year | Tax Paid | Tax Assessment Tax Assessment Total Assessment is a certain percentage of the fair market value that is determined by local assessors to be the total taxable value of land and additions on the property. | Land | Improvement |
|---|---|---|---|---|
| 2025 | $4,048 | $411,808 | $75,000 | $336,808 |
| 2024 | $4,048 | $411,808 | $75,000 | $336,808 |
| 2023 | $7,388 | $387,550 | $75,000 | $312,550 |
| 2022 | $7,368 | $341,940 | $45,000 | $296,940 |
| 2021 | $7,083 | $278,343 | $45,000 | $233,343 |
| 2020 | $6,613 | $259,901 | $45,000 | $214,901 |
| 2019 | $6,389 | $261,634 | $45,000 | $216,634 |
| 2018 | $5,251 | $220,547 | $45,000 | $175,547 |
| 2017 | $5,394 | $219,113 | $45,000 | $174,113 |
| 2016 | $4,904 | $195,753 | $35,000 | $160,753 |
| 2015 | $4,085 | $165,700 | $20,000 | $145,700 |
| 2014 | $4,085 | $165,700 | $20,000 | $145,700 |
Source: Public Records
Map
Nearby Homes
- 9017 Rumfield Rd
- 8417 Patricks Path
- TBD Kirk Ln
- 8428 Hidden Creek Ct
- 7317 Hialeah Cir W
- 8200 Thornhill Dr
- 8048 Green Valley Dr
- 7216 Everglade Dr
- 7321 Fallen Oak Dr
- 7304 Davis Blvd
- 7104 Melissa Ct
- 8966 Hialeah Cir S
- 9205 Cooper Ct
- 7924 Woodland Dr
- 9216 Hailey Ct
- 7404 Forrest Ln
- 8209 Spruce Ct
- 7905 Hallmark Dr
- 9216 Cachelle Ct
- 8112 Autumn Run Ln