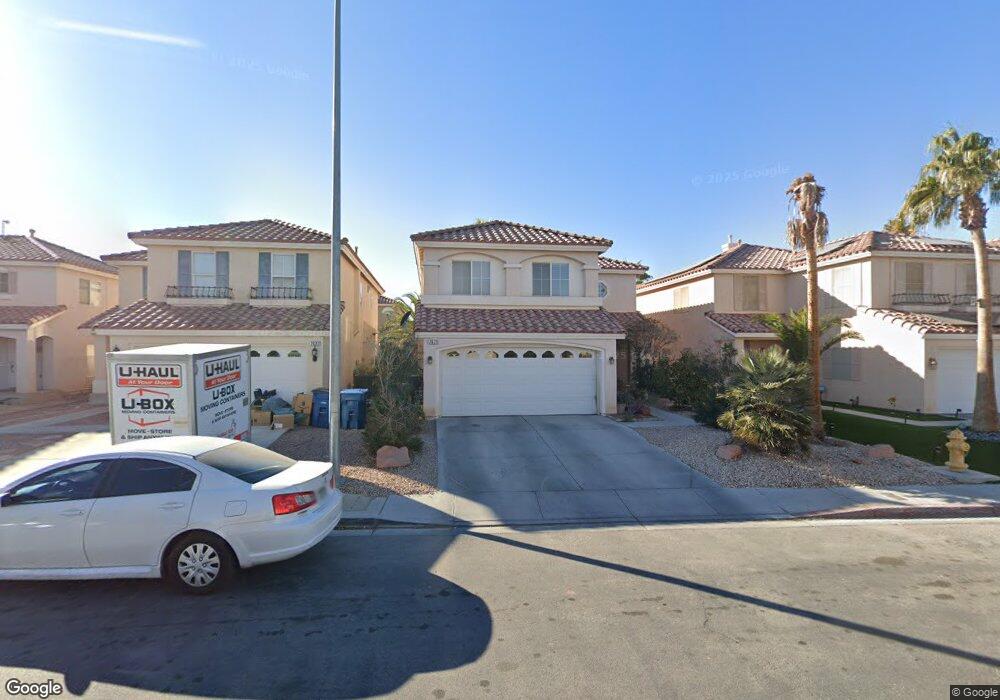
7621 Magic Cove Ct Unit 1 Las Vegas, NV 89139
Coronado Ranch NeighborhoodEstimated Value: $467,000 - $475,369
3
Beds
3
Baths
2,001
Sq Ft
$236/Sq Ft
Est. Value
About This Home
This home is located at 7621 Magic Cove Ct Unit 1, Las Vegas, NV 89139 and is currently estimated at $472,342, approximately $236 per square foot. 7621 Magic Cove Ct Unit 1 is a home located in Clark County with nearby schools including Dr. Beverly S. Mathis Elementary School, Lawrence & Heidi Canarelli Middle School, and Desert Oasis High School.
Ownership History
Date
Name
Owned For
Owner Type
Purchase Details
Closed on
Apr 19, 2002
Sold by
American West Homes Inc
Bought by
Nielander Thomas L and Nielander Nelita
Current Estimated Value
Home Financials for this Owner
Home Financials are based on the most recent Mortgage that was taken out on this home.
Original Mortgage
$75,000
Outstanding Balance
$31,800
Interest Rate
7.13%
Estimated Equity
$440,542
Create a Home Valuation Report for This Property
The Home Valuation Report is an in-depth analysis detailing your home's value as well as a comparison with similar homes in the area
Home Values in the Area
Average Home Value in this Area
Purchase History
| Date | Buyer | Sale Price | Title Company |
|---|---|---|---|
| Nielander Thomas L | $168,450 | First American Title Co |
Source: Public Records
Mortgage History
| Date | Status | Borrower | Loan Amount |
|---|---|---|---|
| Open | Nielander Thomas L | $75,000 |
Source: Public Records
Tax History Compared to Growth
Tax History
| Year | Tax Paid | Tax Assessment Tax Assessment Total Assessment is a certain percentage of the fair market value that is determined by local assessors to be the total taxable value of land and additions on the property. | Land | Improvement |
|---|---|---|---|---|
| 2025 | $2,256 | $127,295 | $36,750 | $90,545 |
| 2024 | $2,191 | $127,295 | $36,750 | $90,545 |
| 2023 | $1,788 | $118,348 | $33,250 | $85,098 |
| 2022 | $2,128 | $106,796 | $28,700 | $78,096 |
| 2021 | $2,066 | $100,065 | $25,900 | $74,165 |
| 2020 | $2,003 | $96,998 | $23,450 | $73,548 |
| 2019 | $1,944 | $94,531 | $22,400 | $72,131 |
| 2018 | $1,888 | $86,468 | $17,150 | $69,318 |
| 2017 | $2,544 | $86,736 | $16,450 | $70,286 |
| 2016 | $1,788 | $82,227 | $12,250 | $69,977 |
| 2015 | $1,784 | $72,739 | $10,500 | $62,239 |
| 2014 | $1,732 | $57,291 | $6,300 | $50,991 |
Source: Public Records
Map
Nearby Homes
- 7468 Treasure Chest St
- 7766 Pacific Dunes St
- 5481 Railroad River Ave
- 7724 Somerhill Point Way
- 7569 Garden Galley St
- 7813 Westwind Rd
- 7478 Coastal Ledge St
- 7819 Harp Tree St
- 5431 Hasley Canyon Ave
- 5390 Montauck Ave
- 5597 Fewkes Canyon Ct
- 6111 Walker Valley Ct
- 7825 Bright Lodge St
- 6016 Sombria Ridge Ave
- 7658 Sandhaven St
- 7688 Sandhaven St
- 7432 Decoro St
- 7881 Tyrell Peaks St
- 7665 Sandhaven St
- 7463 Grizzly Giant St
- 7615 Magic Cove Ct
- 7627 Magic Cove Ct
- 7609 Magic Cove Ct
- 7622 Distant Mirage Ct
- 7616 Distant Mirage Ct Unit 1
- 7628 Distant Mirage Ct
- 7610 Distant Mirage Ct
- 7639 Magic Cove Ct
- 7603 Magic Cove Ct
- 7634 Distant Mirage Ct
- 7604 Distant Mirage Ct
- 7620 Magic Cove Ct
- 7626 Magic Cove Ct
- 7645 Magic Cove Ct
- 7640 Distant Mirage Ct Unit 1
- 7614 Magic Cove Ct
- 7614 Magic Cove Ct
- 7614 Magic Cove Ct
- 7599 Aurora Glow St Unit 2
- 7632 Magic Cove Ct