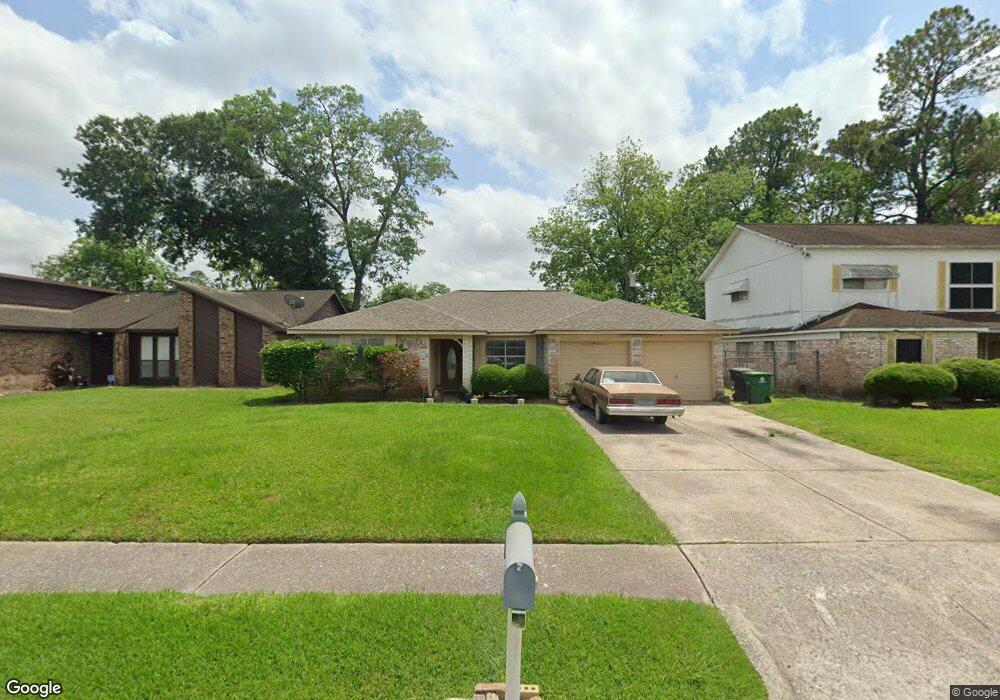
7622 Ferol Rd Houston, TX 77016
East Little York NeighborhoodEstimated Value: $169,000 - $190,000
3
Beds
2
Baths
1,648
Sq Ft
$109/Sq Ft
Est. Value
About This Home
This home is located at 7622 Ferol Rd, Houston, TX 77016 and is currently estimated at $179,646, approximately $109 per square foot. 7622 Ferol Rd is a home located in Harris County with nearby schools including Shadydale Elementary School, Forest Brook Middle, and North Forest High School.
Ownership History
Date
Name
Owned For
Owner Type
Purchase Details
Closed on
Dec 28, 2017
Sold by
Jones Pavalin S
Bought by
Smith Ozell and Smith Rhonda L
Current Estimated Value
Home Financials for this Owner
Home Financials are based on the most recent Mortgage that was taken out on this home.
Original Mortgage
$741,000
Outstanding Balance
$622,556
Interest Rate
3.95%
Mortgage Type
New Conventional
Estimated Equity
-$442,910
Purchase Details
Closed on
Jul 24, 2017
Sold by
Jones Pavalin S and Smith Franklin Delano
Bought by
Jones Pavalin S
Purchase Details
Closed on
Mar 4, 2017
Sold by
Smith Ronald
Bought by
Jones Pavalin S
Purchase Details
Closed on
Mar 1, 2017
Sold by
Branch Ruby L
Bought by
Jones Pavalin S
Purchase Details
Closed on
Feb 28, 2017
Sold by
Smith Ozell D
Bought by
Jones Pavalin S
Purchase Details
Closed on
Feb 17, 2017
Sold by
Smith Franklin D
Bought by
Jones Pavalin S
Create a Home Valuation Report for This Property
The Home Valuation Report is an in-depth analysis detailing your home's value as well as a comparison with similar homes in the area
Home Values in the Area
Average Home Value in this Area
Purchase History
| Date | Buyer | Sale Price | Title Company |
|---|---|---|---|
| Smith Ozell | -- | Metropolitan Title & Escrow | |
| Jones Pavalin S | -- | Metropolitan Escrow & Title | |
| Jones Pavalin S | -- | None Available | |
| Jones Pavalin S | -- | None Available | |
| Jones Pavalin S | -- | None Available | |
| Jones Pavalin S | -- | None Available |
Source: Public Records
Mortgage History
| Date | Status | Borrower | Loan Amount |
|---|---|---|---|
| Open | Smith Ozell | $741,000 |
Source: Public Records
Tax History Compared to Growth
Tax History
| Year | Tax Paid | Tax Assessment Tax Assessment Total Assessment is a certain percentage of the fair market value that is determined by local assessors to be the total taxable value of land and additions on the property. | Land | Improvement |
|---|---|---|---|---|
| 2025 | $3,295 | $157,460 | $44,303 | $113,157 |
| 2024 | $3,295 | $157,460 | $44,303 | $113,157 |
| 2023 | $3,295 | $193,317 | $44,303 | $149,014 |
| 2022 | $3,689 | $167,542 | $37,214 | $130,328 |
| 2021 | $3,128 | $134,199 | $24,810 | $109,389 |
| 2020 | $2,905 | $119,952 | $18,430 | $101,522 |
| 2019 | $2,885 | $113,994 | $13,468 | $100,526 |
| 2018 | $1,849 | $73,073 | $12,121 | $60,952 |
| 2017 | $1,848 | $73,073 | $12,121 | $60,952 |
| 2016 | $1,079 | $68,504 | $12,121 | $56,383 |
| 2015 | -- | $61,584 | $12,121 | $49,463 |
| 2014 | -- | $53,596 | $12,121 | $41,475 |
Source: Public Records
Map
Nearby Homes
- 000 Rebel Rd
- 7615 Nevaeh Crest Path
- 7451 Langley Rd
- 7735 Nevaeh Crest Path
- 7726 Melanie St
- 7449 Gleason Rd
- Kitson Plan at Wayside Village
- Oakridge Plan at Wayside Village
- Barlow Plan at Wayside Village
- Pinehollow Plan at Wayside Village
- Idlewood Plan at Wayside Village
- RC Somerville Plan at Wayside Village
- Whitetail Plan at Wayside Village
- 10707 Bird of Paradise Ln
- 0 Cheeves Dr Unit 62643937
- 7618 Boggess Rd
- 7818 Laurel Gem Dr
- 7827 Laurel Gem Dr
- 7823 Laurel Gem Dr
- 7821 Laurel Gem Dr