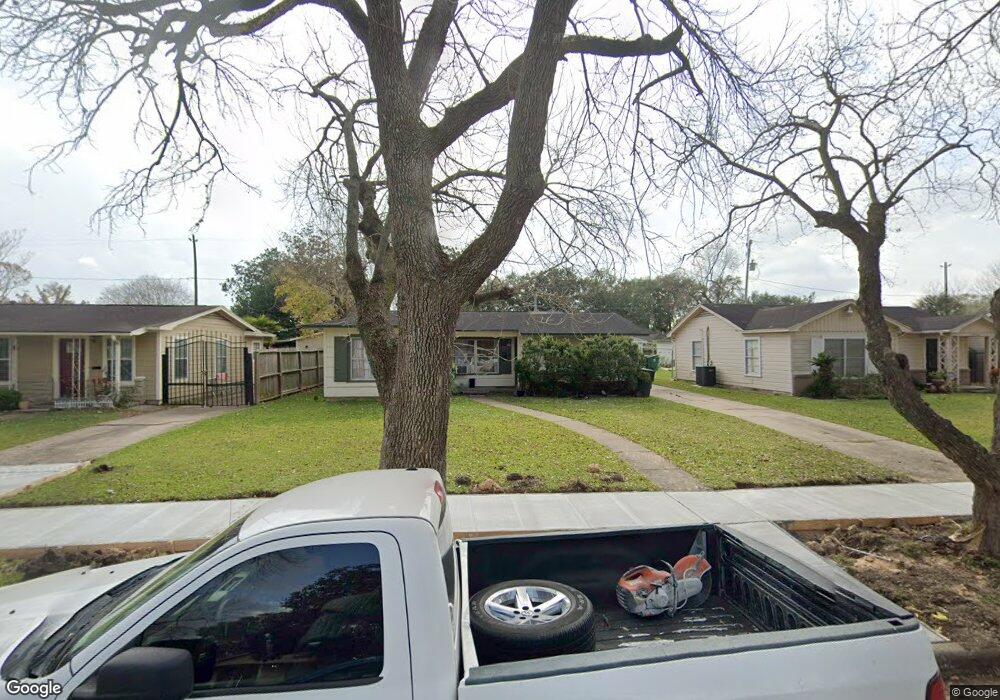
7622 Hereford St Houston, TX 77087
Golfcrest-Bellfort-Reveille NeighborhoodEstimated Value: $187,000 - $205,000
3
Beds
2
Baths
1,376
Sq Ft
$142/Sq Ft
Est. Value
About This Home
This home is located at 7622 Hereford St, Houston, TX 77087 and is currently estimated at $195,973, approximately $142 per square foot. 7622 Hereford St is a home located in Harris County with nearby schools including Cornelius Elementary School, Hartman Middle School, and Ross Shaw Sterling Aviation High School.
Ownership History
Date
Name
Owned For
Owner Type
Purchase Details
Closed on
Sep 25, 2002
Sold by
Hud
Bought by
Morales Jose F
Current Estimated Value
Home Financials for this Owner
Home Financials are based on the most recent Mortgage that was taken out on this home.
Original Mortgage
$74,690
Outstanding Balance
$31,132
Interest Rate
6.21%
Estimated Equity
$164,841
Purchase Details
Closed on
Feb 13, 2002
Sold by
Countrywide Home Loans Inc
Bought by
Hud
Purchase Details
Closed on
Oct 15, 1998
Sold by
Trevino Norberto and Trevino Irma
Bought by
Countrywide Home Loans Inc
Home Financials for this Owner
Home Financials are based on the most recent Mortgage that was taken out on this home.
Original Mortgage
$59,867
Interest Rate
6.73%
Mortgage Type
FHA
Create a Home Valuation Report for This Property
The Home Valuation Report is an in-depth analysis detailing your home's value as well as a comparison with similar homes in the area
Home Values in the Area
Average Home Value in this Area
Purchase History
| Date | Buyer | Sale Price | Title Company |
|---|---|---|---|
| Morales Jose F | -- | First American Title | |
| Hud | -- | First American Title | |
| Countrywide Home Loans Inc | $70,578 | -- | |
| Trevino Norberto | -- | Texas American Title Company |
Source: Public Records
Mortgage History
| Date | Status | Borrower | Loan Amount |
|---|---|---|---|
| Open | Morales Jose F | $74,690 | |
| Previous Owner | Trevino Norberto | $59,867 |
Source: Public Records
Tax History Compared to Growth
Tax History
| Year | Tax Paid | Tax Assessment Tax Assessment Total Assessment is a certain percentage of the fair market value that is determined by local assessors to be the total taxable value of land and additions on the property. | Land | Improvement |
|---|---|---|---|---|
| 2025 | $1,756 | $183,219 | $57,063 | $126,156 |
| 2024 | $1,756 | $176,086 | $49,930 | $126,156 |
| 2023 | $1,756 | $176,086 | $49,930 | $126,156 |
| 2022 | $3,042 | $154,650 | $49,930 | $104,720 |
| 2021 | $2,741 | $145,273 | $28,531 | $116,742 |
| 2020 | $2,749 | $121,636 | $21,399 | $100,237 |
| 2019 | $2,605 | $100,036 | $21,399 | $78,637 |
| 2018 | $1,496 | $88,350 | $21,399 | $66,951 |
| 2017 | $2,314 | $88,350 | $21,399 | $66,951 |
| 2016 | $2,104 | $78,552 | $21,399 | $57,153 |
| 2015 | $1,282 | $74,643 | $21,399 | $53,244 |
| 2014 | $1,282 | $74,643 | $21,399 | $53,244 |
Source: Public Records
Map
Nearby Homes
- 7735 Oak Vista St
- 7837 Leonora St
- 7819 Leonora St
- 7734 El Rancho St
- 7908 Grove Ridge Dr
- 7758 Hereford St
- 7936 Grove Ridge Dr
- 7954 Grove Ridge Dr
- 7486 Stanwick Dr
- 6023 Winterhaven Dr
- 3731 Reveille St
- 7909 Dixie Dr
- 7337 Moline St
- 0 Dover St Unit 39828065
- 7309 Moline St
- 7802 Santa Elena St
- 7355 Bellfort St
- 7659 Greenstone St
- 7543 Greenstone St
- 7507 Greenstone St
- 7618 Hereford St
- 7626 Hereford St
- 7614 Hereford St
- 7630 Hereford St
- 7619 Oak Vista St
- 7623 Oak Vista St
- 7615 Oak Vista St
- 7627 Oak Vista St
- 7610 Hereford St
- 7634 Hereford St
- 7623 Hereford St
- 7627 Hereford St
- 7619 Hereford St
- 7611 Oak Vista St
- 7631 Oak Vista St
- 7631 Hereford St
- 7615 Hereford St
- 7606 Hereford St
- 7638 Hereford St
- 7635 Hereford St