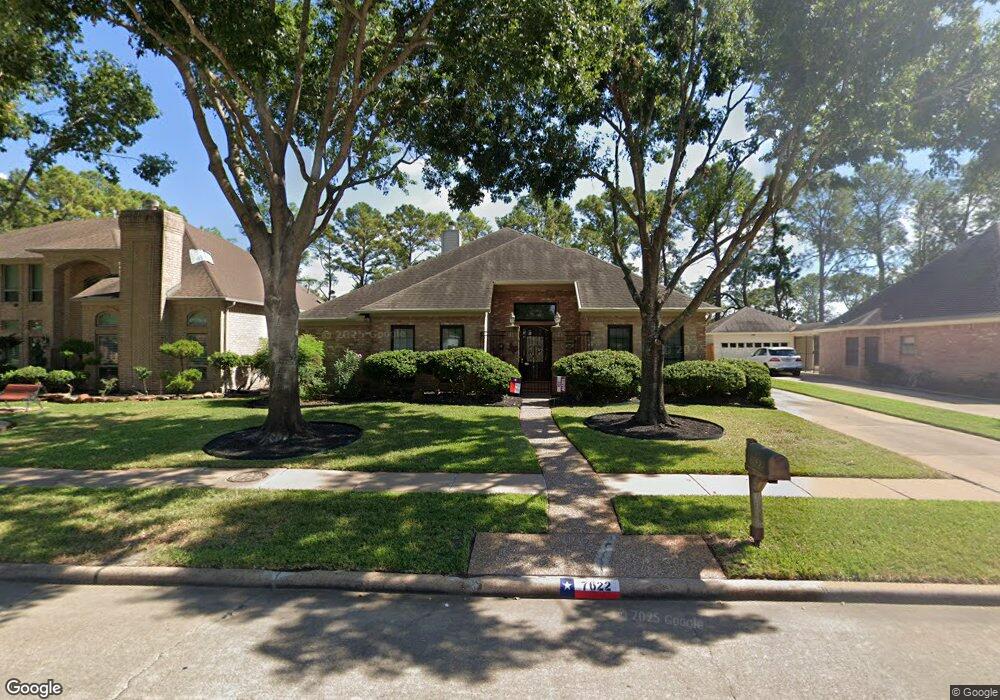
7622 River Garden Dr Houston, TX 77095
Copperfield NeighborhoodEstimated Value: $355,000 - $395,000
3
Beds
2
Baths
3,030
Sq Ft
$123/Sq Ft
Est. Value
About This Home
This home is located at 7622 River Garden Dr, Houston, TX 77095 and is currently estimated at $373,996, approximately $123 per square foot. 7622 River Garden Dr is a home located in Harris County with nearby schools including Lowery Elementary School, Aragon Middle School, and Langham Creek High School.
Ownership History
Date
Name
Owned For
Owner Type
Purchase Details
Closed on
Feb 24, 2000
Sold by
Eckersley Marilyn I and Eckersley Bruce Lee
Bought by
Subieta Karen Krafka
Current Estimated Value
Home Financials for this Owner
Home Financials are based on the most recent Mortgage that was taken out on this home.
Original Mortgage
$132,000
Outstanding Balance
$43,731
Interest Rate
8.19%
Estimated Equity
$330,265
Purchase Details
Closed on
Sep 25, 1998
Sold by
Ellsworth Lawrence K
Bought by
Eckersley Marilyn I
Home Financials for this Owner
Home Financials are based on the most recent Mortgage that was taken out on this home.
Original Mortgage
$55,000
Interest Rate
6.92%
Purchase Details
Closed on
Jun 23, 1994
Sold by
Greathouse James W and Greathouse Crystal E
Bought by
Ellsworth Arthur C and Ellsworth Margaret L
Create a Home Valuation Report for This Property
The Home Valuation Report is an in-depth analysis detailing your home's value as well as a comparison with similar homes in the area
Home Values in the Area
Average Home Value in this Area
Purchase History
| Date | Buyer | Sale Price | Title Company |
|---|---|---|---|
| Subieta Karen Krafka | -- | Chicago Title | |
| Eckersley Marilyn I | -- | Chicago Title Insurance Co | |
| Ellsworth Arthur C | -- | -- |
Source: Public Records
Mortgage History
| Date | Status | Borrower | Loan Amount |
|---|---|---|---|
| Open | Subieta Karen Krafka | $132,000 | |
| Previous Owner | Eckersley Marilyn I | $55,000 | |
| Closed | Subieta Karen Krafka | $16,500 |
Source: Public Records
Tax History Compared to Growth
Tax History
| Year | Tax Paid | Tax Assessment Tax Assessment Total Assessment is a certain percentage of the fair market value that is determined by local assessors to be the total taxable value of land and additions on the property. | Land | Improvement |
|---|---|---|---|---|
| 2025 | $2,746 | $346,557 | $84,753 | $261,804 |
| 2024 | $2,746 | $369,361 | $70,551 | $298,810 |
| 2023 | $2,746 | $350,000 | $70,551 | $279,449 |
| 2022 | $7,777 | $345,000 | $50,394 | $294,606 |
| 2021 | $7,462 | $285,157 | $50,394 | $234,763 |
| 2020 | $7,846 | $289,794 | $38,941 | $250,853 |
| 2019 | $7,821 | $283,219 | $35,734 | $247,485 |
| 2018 | $2,578 | $255,000 | $35,734 | $219,266 |
| 2017 | $7,111 | $255,000 | $35,734 | $219,266 |
| 2016 | $6,553 | $235,000 | $35,734 | $199,266 |
| 2015 | $4,794 | $259,392 | $35,734 | $223,658 |
| 2014 | $4,794 | $206,000 | $35,734 | $170,266 |
Source: Public Records
Map
Nearby Homes
- 7731 Club Lake Dr
- 15810 Knoll Lake Dr
- 7415 Broken Ridge Dr
- 7411 Pacific Ridge Ct
- 15726 Echo Lodge Dr
- 7318 River Garden Dr
- 7827 Alamar Dr
- 15854 Knolls Lodge Dr
- 7418 Benwich Cir
- 15914 Waybridge Glen Ln
- 7419 Foxton Place Ct
- 7414 Starbridge Dr
- 7403 Foxton Place Ct
- 15131 New Hastings Dr
- 7318 Starbridge Dr
- 7407 Bull Creek Rd
- 7411 Marble Glen Ln
- 7511 Marble Glen Ln
- 14931 Inverrary Dr
- 7202 Benwich Cir
- 7618 River Garden Dr
- 7626 River Garden Dr
- 7630 River Garden Dr
- 7614 River Garden Dr
- 15702 Windy Glen Dr
- 7726 Creek Glen Dr
- 7702 River Garden Dr
- 7610 River Garden Dr
- 15706 Windy Glen Dr
- 7722 Creek Glen Dr
- 15703 Windy Glen Dr
- 7706 River Garden Dr
- 7606 River Garden Dr
- 7727 Creek Glen Dr
- 15707 Windy Glen Dr
- 15710 Windy Glen Dr
- 7718 Creek Glen Dr
- 7723 Creek Glen Dr
- 15702 Woodcroft Dr
- 7602 River Garden Dr