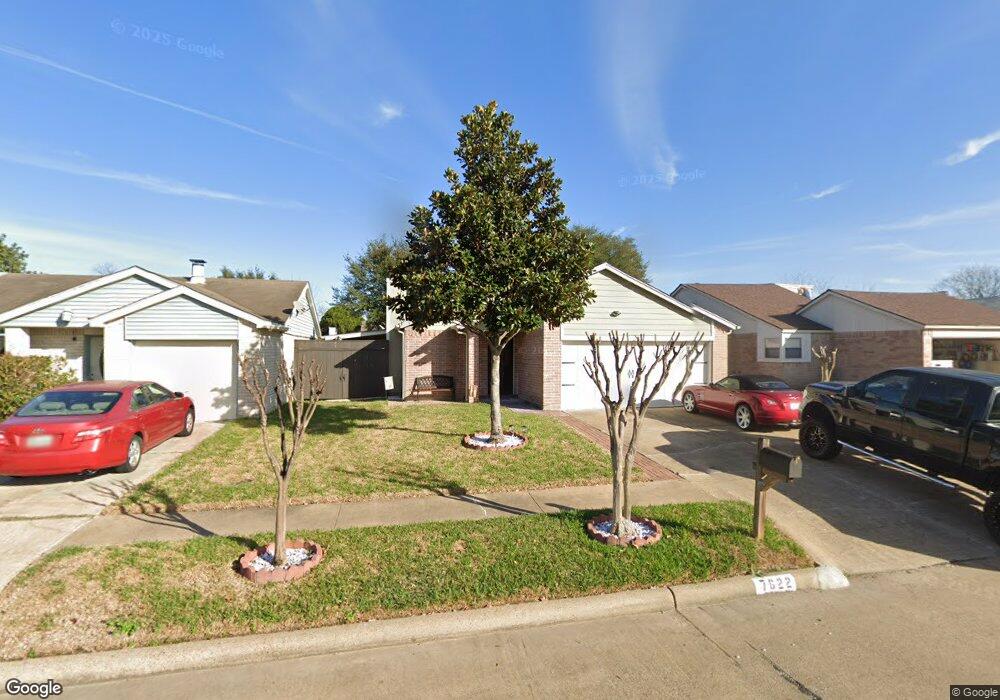
7622 Shaddock Dr Houston, TX 77041
Hearthstone NeighborhoodEstimated Value: $191,633 - $218,000
3
Beds
2
Baths
1,125
Sq Ft
$178/Sq Ft
Est. Value
About This Home
This home is located at 7622 Shaddock Dr, Houston, TX 77041 and is currently estimated at $200,658, approximately $178 per square foot. 7622 Shaddock Dr is a home located in Harris County with nearby schools including Hairgrove Elementary School, Labay Middle School, and Cypress Falls High School.
Ownership History
Date
Name
Owned For
Owner Type
Purchase Details
Closed on
Nov 18, 2015
Sold by
Maldonado Florentino A and Gonzales Olivia Maldonado
Bought by
Maldonado Florentino A and Gonzales Olivia Maldonado
Current Estimated Value
Home Financials for this Owner
Home Financials are based on the most recent Mortgage that was taken out on this home.
Original Mortgage
$38,000
Outstanding Balance
$759
Interest Rate
3.81%
Mortgage Type
Stand Alone First
Estimated Equity
$199,899
Purchase Details
Closed on
Sep 29, 1995
Sold by
Hud
Bought by
Maldonado Florentino A and Maldonado Olivia
Home Financials for this Owner
Home Financials are based on the most recent Mortgage that was taken out on this home.
Original Mortgage
$40,082
Interest Rate
7.88%
Mortgage Type
FHA
Purchase Details
Closed on
May 29, 1995
Sold by
Midfirst Bank State Svgs Bank
Bought by
Hud
Purchase Details
Closed on
May 2, 1995
Sold by
Cox Gary Ronald and Cox Jo Ann P
Bought by
Stm Mtg Company
Create a Home Valuation Report for This Property
The Home Valuation Report is an in-depth analysis detailing your home's value as well as a comparison with similar homes in the area
Home Values in the Area
Average Home Value in this Area
Purchase History
| Date | Buyer | Sale Price | Title Company |
|---|---|---|---|
| Maldonado Florentino A | -- | None Available | |
| Maldonado Florentino A | $40,500 | -- | |
| Hud | -- | -- | |
| Stm Mtg Company | $47,994 | -- |
Source: Public Records
Mortgage History
| Date | Status | Borrower | Loan Amount |
|---|---|---|---|
| Open | Maldonado Florentino A | $38,000 | |
| Closed | Maldonado Florentino A | $40,082 |
Source: Public Records
Tax History
| Year | Tax Paid | Tax Assessment Tax Assessment Total Assessment is a certain percentage of the fair market value that is determined by local assessors to be the total taxable value of land and additions on the property. | Land | Improvement |
|---|---|---|---|---|
| 2025 | $48 | $188,299 | $71,771 | $116,528 |
| 2024 | $48 | $202,280 | $71,771 | $130,509 |
| 2023 | $48 | $184,653 | $51,577 | $133,076 |
| 2022 | $4,216 | $171,776 | $39,570 | $132,206 |
| 2021 | $4,054 | $144,206 | $39,570 | $104,636 |
| 2020 | $3,929 | $134,360 | $28,654 | $105,706 |
| 2019 | $3,755 | $124,528 | $20,172 | $104,356 |
| 2018 | $1,647 | $114,389 | $20,172 | $94,217 |
| 2017 | $3,348 | $110,627 | $20,172 | $90,455 |
| 2016 | $3,032 | $100,199 | $20,172 | $80,027 |
| 2015 | $1,782 | $87,174 | $13,372 | $73,802 |
| 2014 | $1,782 | $74,896 | $8,386 | $66,510 |
Source: Public Records
Map
Nearby Homes
- 7607 Stamen Dr
- 13330 Chimney Sweep Dr
- 7511 Weatherhill Ln
- 7530 Lemma Dr
- 7607 Brookleaf Dr
- 13210 Chimney Sweep Dr
- 7914 Ingle Oak Dr
- 13323 Firebrick Dr
- 13215 Vista Oro Dr
- 7439 Kite Hill Dr
- 7530 Millbrae Ln
- 7415 Fountaincrest Dr
- 7315 Weatherhill Ln
- 13907 Flagstone Dr
- 13222 Noblecrest Dr
- 7915 Fall Hollow Dr
- 13202 Chasworth Dr
- 13814 Swan Hollow Ln
- 7923 Split Cypress Ln
- 13811 Brannon Field Ln
- 7626 Shaddock Dr
- 7618 Shaddock Dr
- 7630 Shaddock Dr
- 7614 Shaddock Dr
- 7623 Log Cradle Dr
- 7627 Log Cradle Dr
- 7619 Log Cradle Dr
- 7631 Log Cradle Dr
- 7634 Shaddock Dr
- 7610 Shaddock Dr
- 7615 Log Cradle Dr
- 7623 Shaddock Dr
- 7627 Shaddock Dr
- 7619 Shaddock Dr
- 7635 Log Cradle Dr
- 7611 Log Cradle Dr
- 7615 Shaddock Dr
- 7631 Shaddock Dr
- 7606 Shaddock Dr
- 7611 Shaddock Dr
Your Personal Tour Guide
Ask me questions while you tour the home.