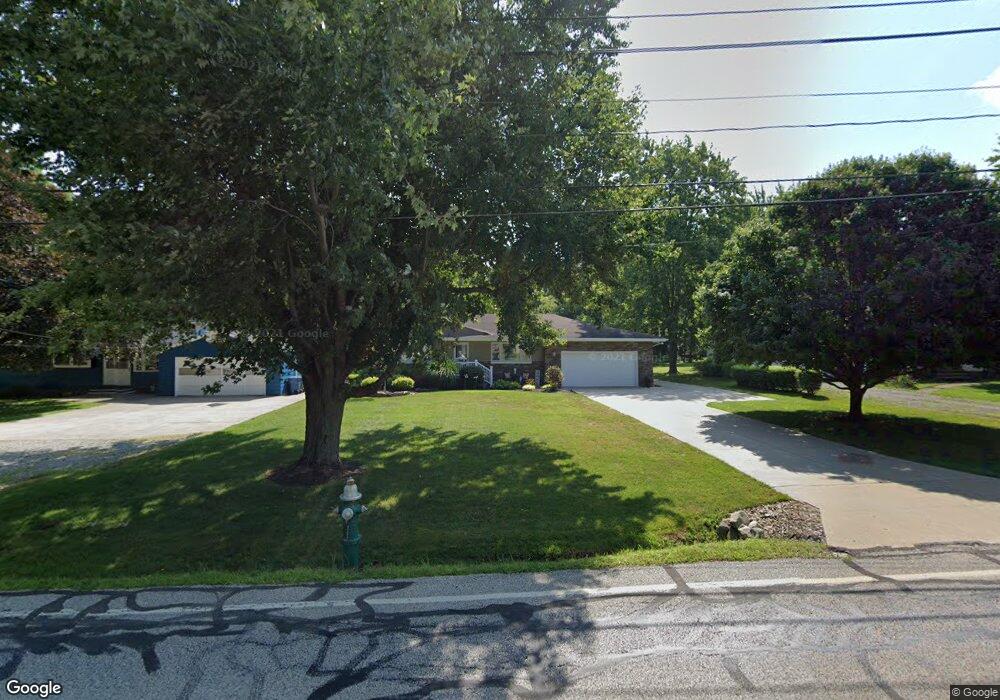
7623 Fitch Rd Olmsted Township, OH 44138
Estimated Value: $276,000 - $323,000
3
Beds
2
Baths
1,622
Sq Ft
$187/Sq Ft
Est. Value
About This Home
This home is located at 7623 Fitch Rd, Olmsted Township, OH 44138 and is currently estimated at $303,169, approximately $186 per square foot. 7623 Fitch Rd is a home located in Cuyahoga County with nearby schools including Falls-Lenox Primary Elementary School, Olmsted Falls Intermediate Building, and Olmsted Falls Middle School.
Ownership History
Date
Name
Owned For
Owner Type
Purchase Details
Closed on
Oct 5, 2023
Sold by
Schiffhauer Bruce M and Schiffhauer Tracy A
Bought by
Schiffhauer Trust and Schiffhauer
Current Estimated Value
Purchase Details
Closed on
Sep 14, 1999
Sold by
Schiffhauer Carroll A
Bought by
Schiffhauer Bruce M
Purchase Details
Closed on
Aug 21, 1987
Sold by
Wisinski Gary
Bought by
Schiffhauer Bruce M
Purchase Details
Closed on
Mar 17, 1983
Sold by
Mcmillin Charles E
Bought by
Wisinski Gary
Purchase Details
Closed on
Aug 23, 1982
Sold by
Mcmillin Charles E and Mcmillin L
Bought by
Mcmillin Charles E
Purchase Details
Closed on
Jan 1, 1975
Bought by
Mcmillin Charles E and Mcmillin L
Create a Home Valuation Report for This Property
The Home Valuation Report is an in-depth analysis detailing your home's value as well as a comparison with similar homes in the area
Home Values in the Area
Average Home Value in this Area
Purchase History
| Date | Buyer | Sale Price | Title Company |
|---|---|---|---|
| Schiffhauer Trust | -- | None Listed On Document | |
| Schiffhauer Bruce M | -- | -- | |
| Schiffhauer Bruce M | $73,500 | -- | |
| Wisinski Gary | $65,000 | -- | |
| Mcmillin Charles E | -- | -- | |
| Mcmillin Charles E | -- | -- |
Source: Public Records
Tax History Compared to Growth
Tax History
| Year | Tax Paid | Tax Assessment Tax Assessment Total Assessment is a certain percentage of the fair market value that is determined by local assessors to be the total taxable value of land and additions on the property. | Land | Improvement |
|---|---|---|---|---|
| 2024 | $6,620 | $91,315 | $13,230 | $78,085 |
| 2023 | $5,877 | $66,330 | $10,290 | $56,040 |
| 2022 | $5,870 | $66,330 | $10,290 | $56,040 |
| 2021 | $6,118 | $66,330 | $10,290 | $56,040 |
| 2020 | $5,814 | $55,720 | $8,650 | $47,080 |
| 2019 | $5,281 | $159,200 | $24,700 | $134,500 |
| 2018 | $5,053 | $55,720 | $8,650 | $47,080 |
| 2017 | $5,395 | $55,450 | $7,040 | $48,410 |
| 2016 | $5,370 | $55,450 | $7,040 | $48,410 |
| 2015 | $5,458 | $55,450 | $7,040 | $48,410 |
| 2014 | $5,458 | $55,450 | $7,040 | $48,410 |
Source: Public Records
Map
Nearby Homes
- 52 Periwinkle Dr
- 7224 Pine Woods Way
- 42 Periwinkle Dr
- 3 Fiddle Sticks
- 11 Concert Ct
- 7296 Chestnut Ct
- 3 Concert Ln
- 20 Van Ess Dr
- 16 Van Ess Dr
- 29 Carl Ln
- 27 Sycamore Dr
- 26788 Skyline Dr
- 7087 Mackenzie Rd
- 25725 Cook Rd
- 11 Brookins Dr
- 25950 Bagley Rd
- 55 Patio Ln
- 5 Hawthorn Dr
- 3 Dogwood Ln
- V/L Columbia Rd