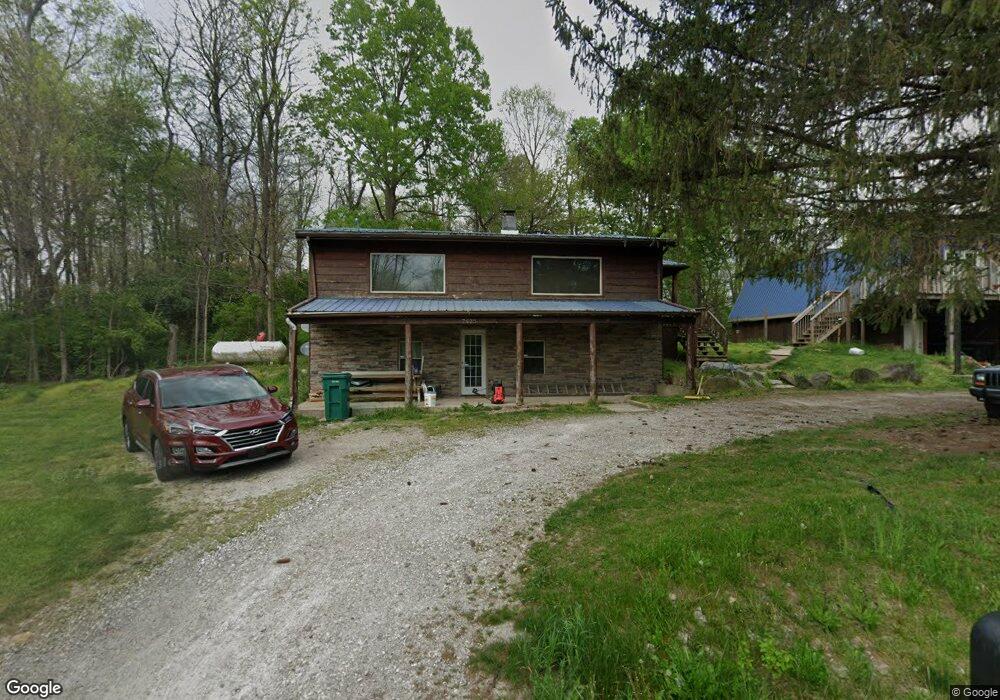
7625 E New Carlisle Rd New Carlisle, OH 45344
Estimated Value: $233,000 - $311,717
3
Beds
1
Bath
999
Sq Ft
$282/Sq Ft
Est. Value
About This Home
This home is located at 7625 E New Carlisle Rd, New Carlisle, OH 45344 and is currently estimated at $281,906, approximately $282 per square foot. 7625 E New Carlisle Rd is a home located in Miami County with nearby schools including Bethel Elementary School, Bethel Middle School, and Bethel High School.
Ownership History
Date
Name
Owned For
Owner Type
Purchase Details
Closed on
May 14, 2014
Sold by
Bayview Loan Servicing Llc
Bought by
Berner Daniel E and Berner Cassie A
Current Estimated Value
Purchase Details
Closed on
Feb 24, 2014
Sold by
Bonham Jason J and Case #12-276
Bought by
Bayview Loan Servicing Llc
Purchase Details
Closed on
Feb 5, 2014
Sold by
Bonham Jason J and Bank Of America Na
Bought by
Bayview Loan Servicing Llc
Purchase Details
Closed on
Sep 15, 2009
Sold by
Rexstation Limited Llc
Bought by
Bonham Jason J
Home Financials for this Owner
Home Financials are based on the most recent Mortgage that was taken out on this home.
Original Mortgage
$198,310
Interest Rate
5.27%
Mortgage Type
FHA
Purchase Details
Closed on
Apr 29, 2008
Sold by
Mcfarland Helen
Bought by
Rex Station Ltd Llc
Purchase Details
Closed on
Mar 8, 2005
Sold by
Mcfarland Helen
Bought by
Arnett Alta
Purchase Details
Closed on
Jun 1, 1986
Bought by
Arnett Robert E
Create a Home Valuation Report for This Property
The Home Valuation Report is an in-depth analysis detailing your home's value as well as a comparison with similar homes in the area
Home Values in the Area
Average Home Value in this Area
Purchase History
| Date | Buyer | Sale Price | Title Company |
|---|---|---|---|
| Berner Daniel E | $85,000 | None Available | |
| Bayview Loan Servicing Llc | $92,000 | Attorney | |
| Bayview Loan Servicing Llc | $92,000 | Attorney | |
| Bonham Jason J | $202,000 | -- | |
| Rex Station Ltd Llc | $70,500 | -- | |
| Arnett Alta | -- | -- | |
| Arnett Robert E | -- | -- |
Source: Public Records
Mortgage History
| Date | Status | Borrower | Loan Amount |
|---|---|---|---|
| Previous Owner | Arnett Alta | $198,310 |
Source: Public Records
Tax History Compared to Growth
Tax History
| Year | Tax Paid | Tax Assessment Tax Assessment Total Assessment is a certain percentage of the fair market value that is determined by local assessors to be the total taxable value of land and additions on the property. | Land | Improvement |
|---|---|---|---|---|
| 2024 | $4,300 | $85,190 | $42,280 | $42,910 |
| 2023 | $4,096 | $85,190 | $42,280 | $42,910 |
| 2022 | $4,052 | $85,190 | $42,280 | $42,910 |
| 2021 | $3,698 | $71,020 | $35,250 | $35,770 |
| 2020 | $3,608 | $71,020 | $35,250 | $35,770 |
| 2019 | $3,650 | $71,020 | $35,250 | $35,770 |
| 2018 | $3,091 | $56,490 | $22,190 | $34,300 |
| 2017 | $3,094 | $56,490 | $22,190 | $34,300 |
| 2016 | $2,788 | $56,490 | $22,190 | $34,300 |
| 2015 | $2,914 | $54,320 | $21,350 | $32,970 |
| 2014 | $2,775 | $54,320 | $21,350 | $32,970 |
| 2013 | $2,356 | $54,320 | $21,350 | $32,970 |
Source: Public Records
Map
Nearby Homes
- 7715 E New Carlisle Rd
- 0 Ohio 201
- 7817 Ohio 201
- 605 Fenview Dr
- 930 Firwood Dr
- 907 White Pine St
- 1101 Cambridge Ct Unit 1103
- 7540 Agenbroad Rd
- 210 Zimmerman St
- 315 Fenwick Dr
- 7032 Honeylocust St
- 224 Orth Dr
- 2656 Addison New Carlisle Rd
- 302 N Smith St
- 222 Rawson Dr
- 201 N Henry St
- 225 Prentice Dr
- 202 Fenwick Dr
- 1211 N Scott St
- 7575 E New Carlisle Rd
- 7525 E New Carlisle Rd
- 7590 E New Carlisle Rd
- 5120 S Dayton Brandt Rd
- 7701 E New Carlisle Rd
- 7415 E New Carlisle Rd
- 5070 S Dayton Brandt Rd
- 5200 S Dayton Brandt Rd
- 5160 S Dayton Brandt Rd
- 1050 S Day Brandt Rd
- 1050 S Dayton Brandt Rd
- 5244 S Dayton Brandt Rd
- 4938 S Dayton Brandt Rd
- 5065 S Dayton Brandt Rd
- 5135 S Dayton Brandt Rd
- 5105 S Dayton Brandt Rd
- 5175 S Dayton Brandt Rd
- 5147 S Dayton Brandt Rd
- 5215 S Dayton Brandt Rd
- 5015 S Dayton Brandt Rd