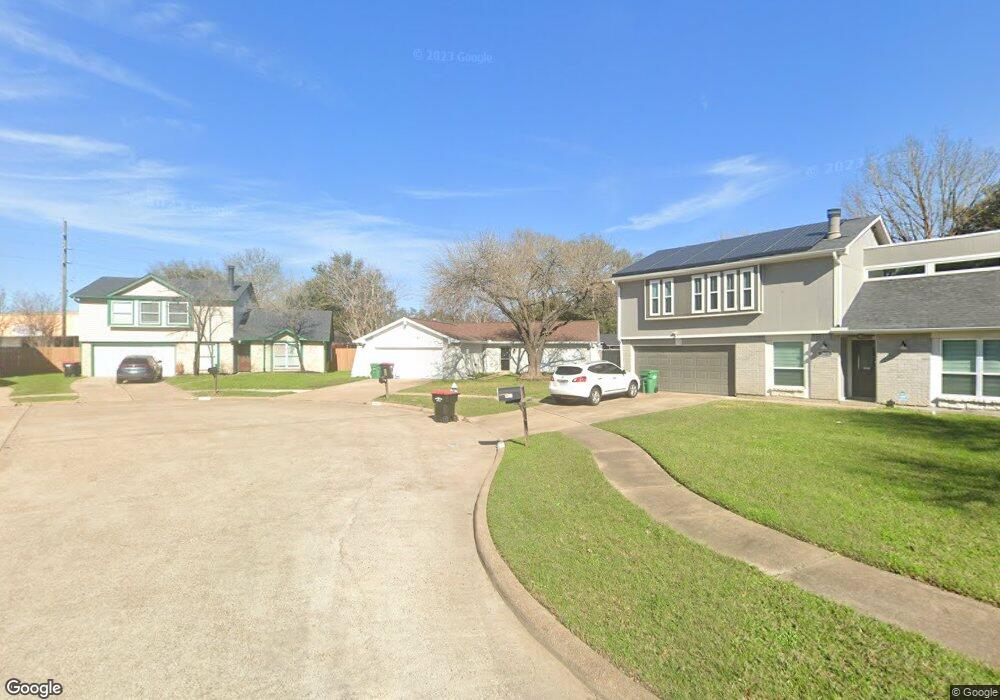
7626 Andiron Cir Houston, TX 77041
Hearthstone NeighborhoodEstimated Value: $201,000 - $211,000
2
Beds
2
Baths
1,248
Sq Ft
$165/Sq Ft
Est. Value
About This Home
This home is located at 7626 Andiron Cir, Houston, TX 77041 and is currently estimated at $206,459, approximately $165 per square foot. 7626 Andiron Cir is a home located in Harris County with nearby schools including Hairgrove Elementary School, Labay Middle School, and Cypress Falls High School.
Ownership History
Date
Name
Owned For
Owner Type
Purchase Details
Closed on
Oct 12, 2018
Sold by
Marin Fernando and Marin Isabel
Bought by
Paredes Juan Luis Marin and Marin Yamilex
Current Estimated Value
Purchase Details
Closed on
Dec 27, 2002
Sold by
Villagomez Jose A and Villagomez Blanca M
Bought by
Marin Fernando and Marin Isabel
Home Financials for this Owner
Home Financials are based on the most recent Mortgage that was taken out on this home.
Original Mortgage
$59,900
Outstanding Balance
$25,442
Interest Rate
5.96%
Mortgage Type
Purchase Money Mortgage
Estimated Equity
$181,017
Purchase Details
Closed on
Nov 20, 1995
Sold by
Miller David Avery and Miller Gay N
Bought by
Villagomez Jose A and Villagomez Blanca M
Home Financials for this Owner
Home Financials are based on the most recent Mortgage that was taken out on this home.
Original Mortgage
$43,250
Interest Rate
7.48%
Mortgage Type
Purchase Money Mortgage
Create a Home Valuation Report for This Property
The Home Valuation Report is an in-depth analysis detailing your home's value as well as a comparison with similar homes in the area
Home Values in the Area
Average Home Value in this Area
Purchase History
| Date | Buyer | Sale Price | Title Company |
|---|---|---|---|
| Paredes Juan Luis Marin | -- | None Available | |
| Marin Fernando | -- | Chicago Title | |
| Villagomez Jose A | -- | -- |
Source: Public Records
Mortgage History
| Date | Status | Borrower | Loan Amount |
|---|---|---|---|
| Open | Marin Fernando | $59,900 | |
| Previous Owner | Villagomez Jose A | $43,250 |
Source: Public Records
Tax History Compared to Growth
Tax History
| Year | Tax Paid | Tax Assessment Tax Assessment Total Assessment is a certain percentage of the fair market value that is determined by local assessors to be the total taxable value of land and additions on the property. | Land | Improvement |
|---|---|---|---|---|
| 2025 | $2,679 | $199,225 | $79,558 | $119,667 |
| 2024 | $2,679 | $213,719 | $79,558 | $134,161 |
| 2023 | $2,679 | $196,376 | $57,173 | $139,203 |
| 2022 | $4,245 | $184,495 | $43,863 | $140,632 |
| 2021 | $4,082 | $152,977 | $43,863 | $109,114 |
| 2020 | $3,860 | $141,943 | $31,763 | $110,180 |
| 2019 | $3,619 | $128,357 | $20,649 | $107,708 |
| 2018 | $1,782 | $123,784 | $20,649 | $103,135 |
| 2017 | $3,569 | $117,933 | $20,649 | $97,284 |
| 2016 | $3,013 | $99,547 | $17,264 | $82,283 |
| 2015 | $2,408 | $99,547 | $17,264 | $82,283 |
| 2014 | $2,408 | $77,821 | $10,832 | $66,989 |
Source: Public Records
Map
Nearby Homes
- 7823 Autumn Hollow Ln
- 7607 Wovenwood Ln
- 7618 Mauna Kai Dr
- 13826 Swan Hollow Ln
- 13814 Swan Hollow Ln
- 13811 Brannon Field Ln
- 7921 Capri Cir
- 14419 Verde Mar Ln
- 14410 Muirfield Ln
- 7511 Weatherhill Ln
- 14519 Sandalfoot St
- 14502 Sandalfoot St
- 8023 Carmel Cir
- 7635 Log Cradle Dr
- 8303 Gros Ventre Ln
- 8043 Oceanside Dr
- 8315 Gros Ventre Ln
- 7315 Millbrae Ln
- 8342 Cassidy Creek Ct
- 14522 Durham Chase Ln
- 7627 Millbrae Ln
- 7622 Andiron Cir
- 7623 Millbrae Ln
- 7618 Andiron Cir
- 7631 Andiron Cir
- 7619 Millbrae Ln
- 7627 Andiron Cir
- 13847 Pickford Knolls Dr
- 13843 Pickford Knolls Dr
- 7623 Andiron Cir
- 7615 Millbrae Ln
- 7630 Millbrae Ln
- 7619 Andiron Cir
- 13839 Pickford Knolls Dr
- 7703 Chateau Point Ln
- 7610 Andiron Cir
- 7615 Andiron Cir
- 7626 Millbrae Ln
- 13835 Pickford Knolls Dr
- 7707 Chateau Point Ln