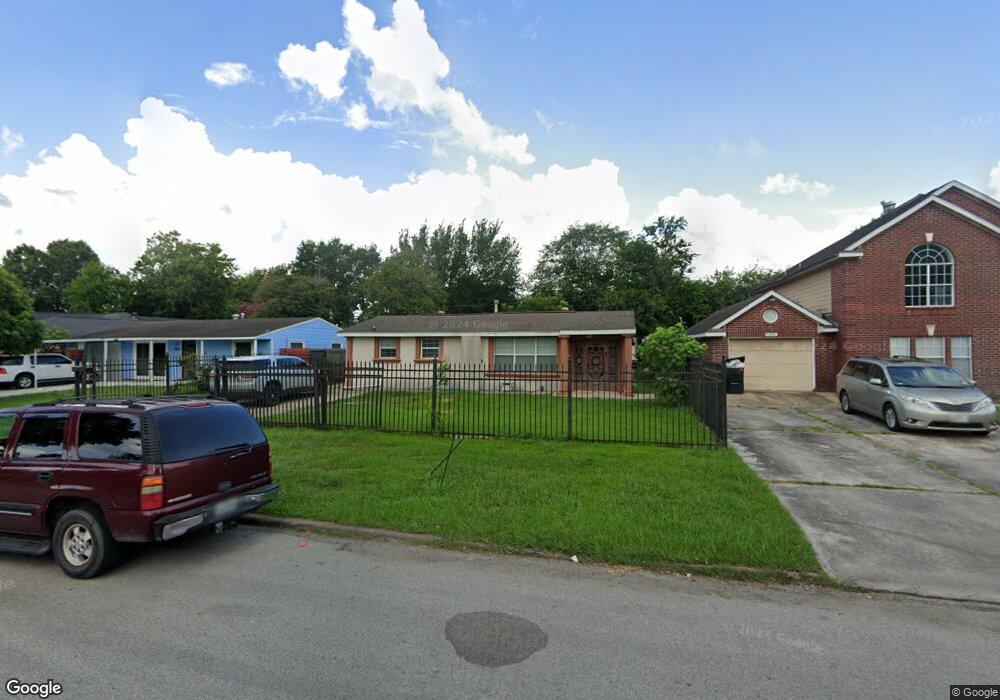
7627 Thurow St Houston, TX 77087
Golfcrest-Bellfort-Reveille NeighborhoodEstimated Value: $206,732 - $227,000
3
Beds
2
Baths
1,386
Sq Ft
$157/Sq Ft
Est. Value
About This Home
This home is located at 7627 Thurow St, Houston, TX 77087 and is currently estimated at $218,183, approximately $157 per square foot. 7627 Thurow St is a home located in Harris County with nearby schools including Golfcrest Elementary School, Hartman Middle School, and Ross Shaw Sterling Aviation High School.
Ownership History
Date
Name
Owned For
Owner Type
Purchase Details
Closed on
Aug 31, 2010
Sold by
Robinson Kelli Marroquin and Marroquin Kelli
Bought by
Villanueva Fernando and Villanueva Maria
Current Estimated Value
Home Financials for this Owner
Home Financials are based on the most recent Mortgage that was taken out on this home.
Original Mortgage
$90,777
Outstanding Balance
$59,730
Interest Rate
4.37%
Mortgage Type
FHA
Estimated Equity
$158,453
Purchase Details
Closed on
Jan 31, 2006
Sold by
Guajardo Mayra
Bought by
Marroquin Kelli
Purchase Details
Closed on
Jan 26, 2006
Sold by
Guajardo Ismael
Bought by
Guajardo Mayra
Purchase Details
Closed on
Feb 6, 1995
Sold by
Hutchinson Richard L and Hutchinson Rone S
Bought by
Guajardo Ismael and Guajardo Mayra
Home Financials for this Owner
Home Financials are based on the most recent Mortgage that was taken out on this home.
Original Mortgage
$45,500
Interest Rate
9.13%
Create a Home Valuation Report for This Property
The Home Valuation Report is an in-depth analysis detailing your home's value as well as a comparison with similar homes in the area
Home Values in the Area
Average Home Value in this Area
Purchase History
| Date | Buyer | Sale Price | Title Company |
|---|---|---|---|
| Villanueva Fernando | -- | Alamo Title Company | |
| Marroquin Kelli | -- | Ameripoint Title | |
| Guajardo Mayra | -- | Ameripoint Title | |
| Guajardo Ismael | -- | Houston Title Company 529 |
Source: Public Records
Mortgage History
| Date | Status | Borrower | Loan Amount |
|---|---|---|---|
| Open | Villanueva Fernando | $90,777 | |
| Previous Owner | Guajardo Ismael | $45,500 |
Source: Public Records
Tax History Compared to Growth
Tax History
| Year | Tax Paid | Tax Assessment Tax Assessment Total Assessment is a certain percentage of the fair market value that is determined by local assessors to be the total taxable value of land and additions on the property. | Land | Improvement |
|---|---|---|---|---|
| 2025 | $1,827 | $185,416 | $57,063 | $128,353 |
| 2024 | $1,827 | $181,372 | $49,930 | $131,442 |
| 2023 | $1,827 | $181,372 | $49,930 | $131,442 |
| 2022 | $2,925 | $159,169 | $49,930 | $109,239 |
| 2021 | $2,815 | $150,466 | $28,531 | $121,935 |
| 2020 | $2,659 | $126,110 | $21,399 | $104,711 |
| 2019 | $2,526 | $105,039 | $21,399 | $83,640 |
| 2018 | $1,544 | $90,732 | $21,399 | $69,333 |
| 2017 | $2,234 | $90,732 | $21,399 | $69,333 |
| 2016 | $2,031 | $80,303 | $21,399 | $58,904 |
| 2015 | $1,419 | $77,325 | $21,399 | $55,926 |
| 2014 | $1,419 | $77,325 | $21,399 | $55,926 |
Source: Public Records
Map
Nearby Homes
- 7703 Mchenry St
- 7546 Greendowns St
- 7543 Greenstone St
- 7659 Greenstone St
- 7507 Greenstone St
- 7393 Fairway Dr Unit B
- 3607 De Leon St
- 7313 Gulf Fwy Unit 814
- 7313 Gulf Fwy Unit 911
- 7313 Gulf Fwy Unit 1011
- 3731 Reveille St
- 7303 Gulf Fwy Unit 903
- 7318 Thurow St
- 7937 Grafton St
- 8023 Findlay St
- 2618 Woodridge Manor Dr
- 2511 Evergreen Dr
- 7007 Woodridge Square Dr
- 7019 Woodridge Square Dr
- 7022 Plum Creek Trail Ln