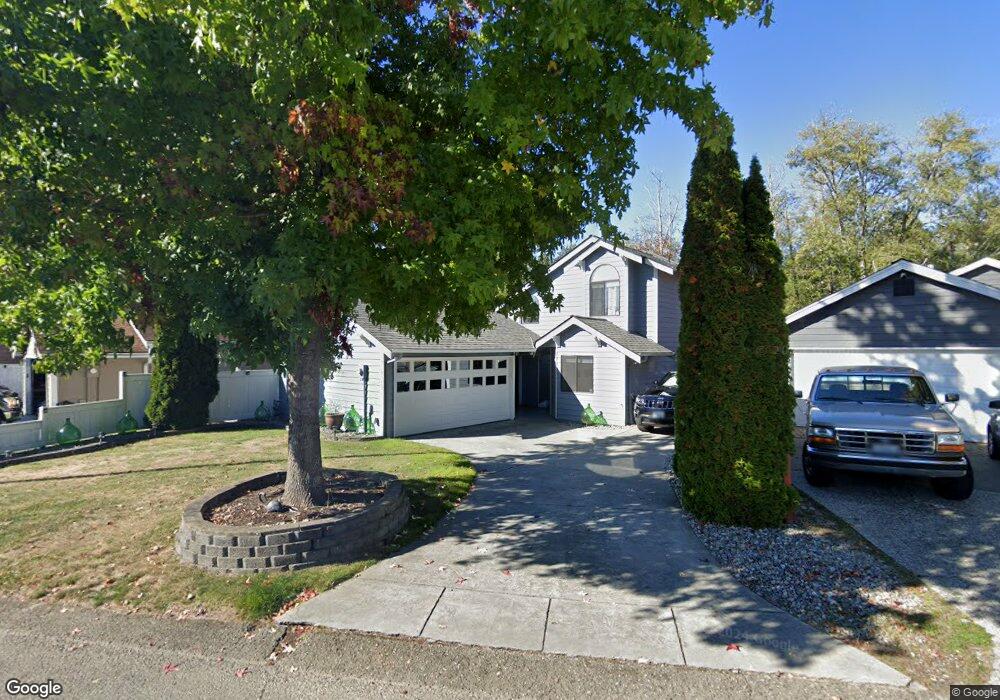
7629 Colony Ct NE Bremerton, WA 98311
Estimated Value: $426,000 - $498,000
3
Beds
2
Baths
1,503
Sq Ft
$309/Sq Ft
Est. Value
About This Home
This home is located at 7629 Colony Ct NE, Bremerton, WA 98311 and is currently estimated at $464,989, approximately $309 per square foot. 7629 Colony Ct NE is a home located in Kitsap County with nearby schools including Cottonwood Elementary School, Ridgetop Middle School, and Olympic High School.
Ownership History
Date
Name
Owned For
Owner Type
Purchase Details
Closed on
Jul 1, 2020
Sold by
Kaimbach Robert and Estate Of Richard W Galasyn
Bought by
Birmingham Matthew Lloyd and Birmingham Yelena Vasilyevna
Current Estimated Value
Home Financials for this Owner
Home Financials are based on the most recent Mortgage that was taken out on this home.
Original Mortgage
$323,501
Outstanding Balance
$287,392
Interest Rate
3.2%
Mortgage Type
VA
Estimated Equity
$177,597
Purchase Details
Closed on
Aug 13, 2004
Sold by
Welch Paulette
Bought by
Galasyn Richard W
Home Financials for this Owner
Home Financials are based on the most recent Mortgage that was taken out on this home.
Original Mortgage
$75,900
Interest Rate
5.76%
Mortgage Type
Purchase Money Mortgage
Purchase Details
Closed on
Sep 29, 1999
Sold by
Cole Annette M
Bought by
Welch Samuel J and Welch Paulette
Home Financials for this Owner
Home Financials are based on the most recent Mortgage that was taken out on this home.
Original Mortgage
$118,750
Interest Rate
10.25%
Create a Home Valuation Report for This Property
The Home Valuation Report is an in-depth analysis detailing your home's value as well as a comparison with similar homes in the area
Home Values in the Area
Average Home Value in this Area
Purchase History
| Date | Buyer | Sale Price | Title Company |
|---|---|---|---|
| Birmingham Matthew Lloyd | $335,000 | Pacific Northwest Ttl Silver | |
| Galasyn Richard W | $186,900 | Pacific Nw Title | |
| Welch Samuel J | $125,000 | First American Title |
Source: Public Records
Mortgage History
| Date | Status | Borrower | Loan Amount |
|---|---|---|---|
| Open | Birmingham Matthew Lloyd | $323,501 | |
| Previous Owner | Galasyn Richard W | $75,900 | |
| Previous Owner | Welch Samuel J | $118,750 |
Source: Public Records
Tax History Compared to Growth
Tax History
| Year | Tax Paid | Tax Assessment Tax Assessment Total Assessment is a certain percentage of the fair market value that is determined by local assessors to be the total taxable value of land and additions on the property. | Land | Improvement |
|---|---|---|---|---|
| 2026 | $3,865 | $407,140 | $92,840 | $314,300 |
| 2025 | $3,865 | $407,140 | $92,840 | $314,300 |
| 2024 | $3,760 | $407,140 | $92,840 | $314,300 |
| 2023 | $3,772 | $407,140 | $92,840 | $314,300 |
| 2022 | $3,553 | $337,530 | $76,730 | $260,800 |
| 2021 | $3,210 | $289,500 | $56,910 | $232,590 |
| 2020 | $3,007 | $274,270 | $53,710 | $220,560 |
| 2019 | $2,809 | $247,670 | $48,500 | $199,170 |
| 2018 | $3,013 | $205,830 | $40,080 | $165,750 |
| 2017 | $2,672 | $205,830 | $40,080 | $165,750 |
| 2016 | $2,586 | $184,150 | $35,780 | $148,370 |
| 2015 | $2,421 | $179,750 | $39,640 | $140,110 |
| 2014 | -- | $171,370 | $39,640 | $131,730 |
| 2013 | -- | $171,370 | $39,640 | $131,730 |
Source: Public Records
Map
Nearby Homes
- 7761 Beacon Place NE Unit G-107
- 7761 Beacon Place NE Unit 103
- 7701 Beacon Place NE Unit B103
- 7529 Bridge Place NE
- 7545 Old Military Rd NE
- 3924 McCormick Village Dr Unit 25
- 7655 Forest Ridge Dr NE
- 0 Kaster Dr NE
- 960 NE Marwood Dr
- 8065 Autumn Hills Place NE
- 8537 Washington 303
- 8259 Kaster Dr NE
- 7726 Lazy s Ln NE
- 7020 Saint Charles Ln NE
- 8640 Washington 303
- 8760 Washington 303 Unit L
- 250 NE Silver Pine Dr
- 8811 Overlook Circle Dr NE Unit 71
- 6522 State Hwy 303 NE
- 2112 NE Lexington Dr
- 7633 Colony Ct NE
- 7625 Colony Ct NE
- 7621 Colony Ct NE
- 7637 Colony Ct NE
- 7628 Colony Ct NE
- 7617 Colony Ct NE
- 7632 Colony Ct NE
- 7624 Colony Ct NE
- 7620 Colony Ct NE
- 7613 Colony Ct NE
- 7640 Colony Ct NE
- 7616 Colony Ct NE
- 7645 Colony Ct NE
- 7644 Colony Ct NE
- 7612 Colony Ct NE
- 7609 Colony Ct NE
- 7649 Colony Ct NE
- 7608 Colony Ct NE
- 7648 Colony Ct NE