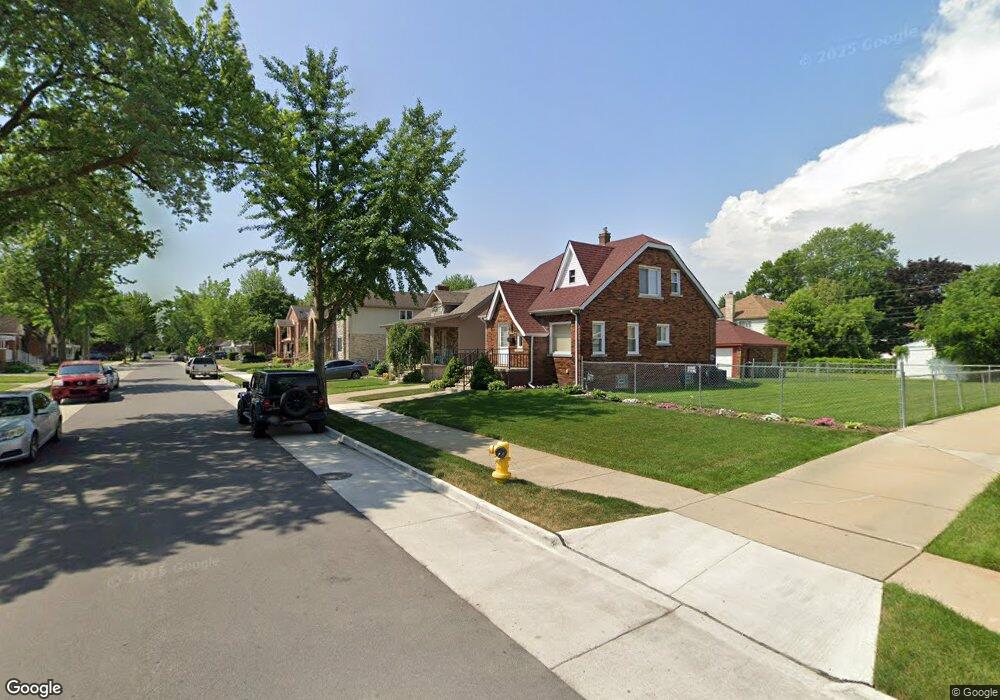
7629 Mead St Unit Bldg-Unit Dearborn, MI 48126
Oakman Grove NeighborhoodEstimated Value: $255,000 - $313,000
3
Beds
3
Baths
1,296
Sq Ft
$209/Sq Ft
Est. Value
About This Home
This home is located at 7629 Mead St Unit Bldg-Unit, Dearborn, MI 48126 and is currently estimated at $271,127, approximately $209 per square foot. 7629 Mead St Unit Bldg-Unit is a home located in Wayne County with nearby schools including Oakman Elementary School, McCollough-Unis School, and Dearborn High School.
Ownership History
Date
Name
Owned For
Owner Type
Purchase Details
Closed on
Jun 1, 2018
Sold by
Makky Montaha
Bought by
Brown Stephen D
Current Estimated Value
Home Financials for this Owner
Home Financials are based on the most recent Mortgage that was taken out on this home.
Original Mortgage
$191,000
Outstanding Balance
$164,997
Interest Rate
4.45%
Mortgage Type
Adjustable Rate Mortgage/ARM
Estimated Equity
$106,130
Purchase Details
Closed on
Jan 18, 2005
Sold by
Elsayed Ali and Elsayed Sharifa
Bought by
Makky Montaha
Create a Home Valuation Report for This Property
The Home Valuation Report is an in-depth analysis detailing your home's value as well as a comparison with similar homes in the area
Home Values in the Area
Average Home Value in this Area
Purchase History
| Date | Buyer | Sale Price | Title Company |
|---|---|---|---|
| Brown Stephen D | $191,000 | First American Title Ins Co | |
| Makky Montaha | $120,000 | American Premier Title Agenc |
Source: Public Records
Mortgage History
| Date | Status | Borrower | Loan Amount |
|---|---|---|---|
| Open | Brown Stephen D | $191,000 |
Source: Public Records
Tax History Compared to Growth
Tax History
| Year | Tax Paid | Tax Assessment Tax Assessment Total Assessment is a certain percentage of the fair market value that is determined by local assessors to be the total taxable value of land and additions on the property. | Land | Improvement |
|---|---|---|---|---|
| 2025 | $2,849 | $92,000 | $0 | $0 |
| 2024 | $2,849 | $110,900 | $0 | $0 |
| 2023 | $2,696 | $90,400 | $0 | $0 |
| 2022 | $3,034 | $81,700 | $0 | $0 |
| 2021 | $3,526 | $76,700 | $0 | $0 |
| 2019 | $3,490 | $55,300 | $0 | $0 |
| 2018 | $1,804 | $40,800 | $0 | $0 |
| 2017 | $517 | $36,700 | $0 | $0 |
| 2016 | $1,688 | $33,700 | $0 | $0 |
| 2015 | $3,190 | $35,050 | $0 | $0 |
| 2013 | $3,090 | $30,900 | $0 | $0 |
| 2011 | -- | $33,950 | $0 | $0 |
Source: Public Records
Map
Nearby Homes