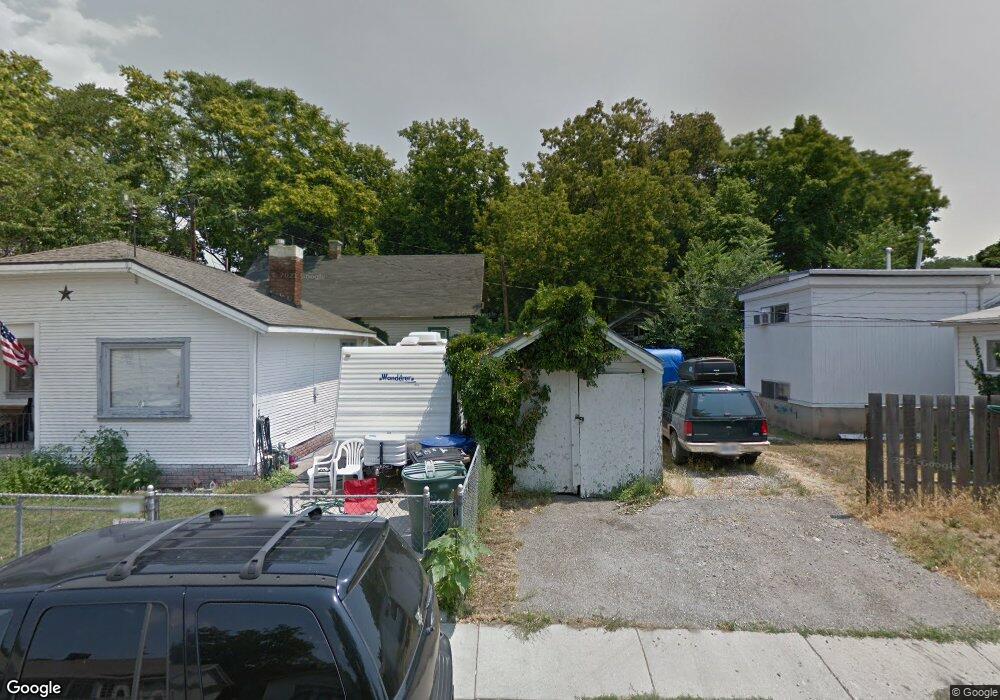
763 E 900 S Salt Lake City, UT 84105
East Central NeighborhoodEstimated Value: $552,000 - $748,329
4
Beds
3
Baths
1,488
Sq Ft
$453/Sq Ft
Est. Value
About This Home
This home is located at 763 E 900 S, Salt Lake City, UT 84105 and is currently estimated at $674,582, approximately $453 per square foot. 763 E 900 S is a home located in Salt Lake County with nearby schools including Bennion Elementary School, East High School, and Salt Lake Arts Academy.
Ownership History
Date
Name
Owned For
Owner Type
Purchase Details
Closed on
Mar 20, 2023
Sold by
Orozco Andres Nevarez
Bought by
Orozco Andres Nevarez and Fallert Danelle Josephine
Current Estimated Value
Purchase Details
Closed on
Aug 19, 2019
Sold by
Orozco Miguel
Bought by
Orozco Andres Nevarez
Home Financials for this Owner
Home Financials are based on the most recent Mortgage that was taken out on this home.
Original Mortgage
$135,000
Interest Rate
3.7%
Mortgage Type
New Conventional
Purchase Details
Closed on
Aug 24, 1998
Sold by
Wolfe Curtis Lynn
Bought by
Orozco Miguel
Home Financials for this Owner
Home Financials are based on the most recent Mortgage that was taken out on this home.
Original Mortgage
$79,703
Interest Rate
6.88%
Mortgage Type
FHA
Create a Home Valuation Report for This Property
The Home Valuation Report is an in-depth analysis detailing your home's value as well as a comparison with similar homes in the area
Home Values in the Area
Average Home Value in this Area
Purchase History
| Date | Buyer | Sale Price | Title Company |
|---|---|---|---|
| Orozco Andres Nevarez | -- | -- | |
| Orozco Andres Nevarez | -- | Inwest Title Srvs Layton | |
| Orozco Miguel | -- | -- | |
| Wolfe Curtis Lynn | -- | -- |
Source: Public Records
Mortgage History
| Date | Status | Borrower | Loan Amount |
|---|---|---|---|
| Previous Owner | Orozco Andres Nevarez | $135,000 | |
| Previous Owner | Orozco Miguel | $79,703 |
Source: Public Records
Tax History Compared to Growth
Tax History
| Year | Tax Paid | Tax Assessment Tax Assessment Total Assessment is a certain percentage of the fair market value that is determined by local assessors to be the total taxable value of land and additions on the property. | Land | Improvement |
|---|---|---|---|---|
| 2025 | $3,530 | $720,800 | $153,800 | $567,000 |
| 2024 | $3,530 | $673,600 | $145,500 | $528,100 |
| 2023 | $2,066 | $379,900 | $150,400 | $229,500 |
| 2022 | $2,279 | $393,200 | $147,500 | $245,700 |
| 2021 | $1,315 | $205,400 | $111,400 | $94,000 |
| 2020 | $1,305 | $194,100 | $104,900 | $89,200 |
| 2019 | $1,398 | $195,600 | $96,300 | $99,300 |
| 2018 | $1,399 | $190,600 | $96,300 | $94,300 |
| 2017 | $1,500 | $191,500 | $96,300 | $95,200 |
| 2016 | $1,480 | $179,400 | $64,500 | $114,900 |
| 2015 | $1,510 | $173,500 | $66,500 | $107,000 |
| 2014 | $1,457 | $166,000 | $65,200 | $100,800 |
Source: Public Records
Map
Nearby Homes