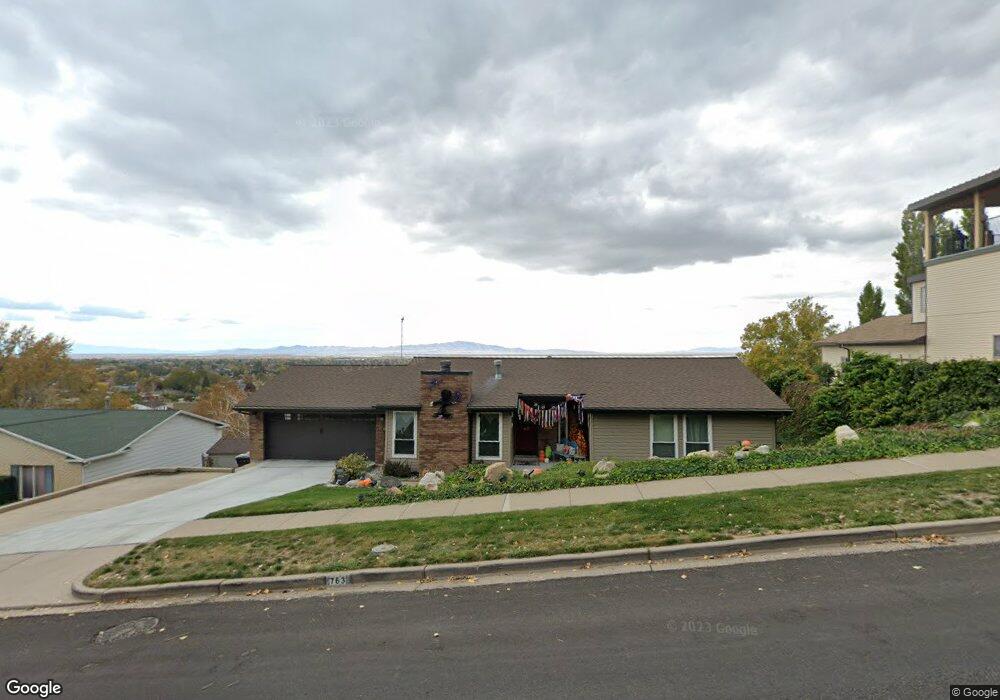
763 Easthills Dr Bountiful, UT 84010
Estimated Value: $580,000 - $616,310
4
Beds
3
Baths
1,486
Sq Ft
$402/Sq Ft
Est. Value
About This Home
This home is located at 763 Easthills Dr, Bountiful, UT 84010 and is currently estimated at $597,578, approximately $402 per square foot. 763 Easthills Dr is a home located in Davis County with nearby schools including Tolman School, Centerville Jr High, and Viewmont High School.
Ownership History
Date
Name
Owned For
Owner Type
Purchase Details
Closed on
Mar 12, 2007
Sold by
Robinson Reid A and Robinson Candice H
Bought by
Robinson Reid A and Robinson Candice D
Current Estimated Value
Home Financials for this Owner
Home Financials are based on the most recent Mortgage that was taken out on this home.
Original Mortgage
$205,000
Outstanding Balance
$123,671
Interest Rate
6.29%
Mortgage Type
New Conventional
Estimated Equity
$473,907
Purchase Details
Closed on
Jun 11, 1996
Sold by
Erickson Mark R and Erickson Clarinda N
Bought by
Robinson Reid A and Robinson Candice H
Home Financials for this Owner
Home Financials are based on the most recent Mortgage that was taken out on this home.
Original Mortgage
$149,600
Interest Rate
8.01%
Create a Home Valuation Report for This Property
The Home Valuation Report is an in-depth analysis detailing your home's value as well as a comparison with similar homes in the area
Purchase History
| Date | Buyer | Sale Price | Title Company |
|---|---|---|---|
| Robinson Reid A | -- | Bonneville Superior Title Co | |
| Robinson Reid A | -- | Associated Title Company | |
| Robinson Reid A | -- | Associated Title Company |
Source: Public Records
Mortgage History
| Date | Status | Borrower | Loan Amount |
|---|---|---|---|
| Open | Robinson Reid A | $205,000 | |
| Closed | Robinson Reid A | $149,600 |
Source: Public Records
Tax History
| Year | Tax Paid | Tax Assessment Tax Assessment Total Assessment is a certain percentage of the fair market value that is determined by local assessors to be the total taxable value of land and additions on the property. | Land | Improvement |
|---|---|---|---|---|
| 2025 | $3,487 | $319,000 | $133,245 | $185,755 |
| 2024 | $3,282 | $310,750 | $122,861 | $187,889 |
| 2023 | $3,239 | $557,000 | $222,641 | $334,359 |
| 2022 | $3,383 | $319,550 | $118,536 | $201,014 |
| 2021 | $2,940 | $424,000 | $176,168 | $247,832 |
| 2020 | $2,619 | $379,000 | $144,372 | $234,628 |
| 2019 | $2,651 | $375,000 | $142,474 | $232,526 |
| 2018 | $2,519 | $351,000 | $132,315 | $218,685 |
| 2016 | $2,282 | $172,756 | $47,900 | $124,856 |
| 2015 | $2,184 | $155,816 | $47,900 | $107,916 |
| 2014 | $2,008 | $146,638 | $47,900 | $98,738 |
| 2013 | -- | $138,713 | $46,530 | $92,183 |
Source: Public Records
Map
Nearby Homes
- 610 E Pages Ln
- 662 E 1200 N
- 610 S 800 E
- 975 E 1050 N
- 282 E 1400 N
- 495 E 475 S
- 345 E 600 S
- 1023 E 800 N
- 967 S Courtyard Ln
- 908 Northern Hills Dr
- 1420 N Main St
- 1105 E 600 N
- 551 N 1100 E
- 96 Village Square Rd
- 83 W 850 S
- 328 E 1100 S
- 1342 Northridge Dr
- 951 Centerville Commons Way
- 360 E Center St
- 453 N 400 E Unit 7-D
- 755 Easthills Dr
- 771 Easthills Dr
- 1524 N 725 E
- 1504 N 725 E
- 1544 N 725 E
- 760 Easthills Dr
- 1543 N Easthills Cir
- 724 E 1500 N
- 779 Easthills Dr
- 1543 E Hills Cir
- 1519 N Easthills Cir
- 1567 E Hills Cir
- 1564 N 725 E
- 1519 N 725 E
- 1567 N Easthills Cir
- 752 E Hills Dr N
- 752 Easthills Dr
- 1483 N Easthills Cir
- 720 E 1500 N
- 1543 N 725 E
Your Personal Tour Guide
Ask me questions while you tour the home.