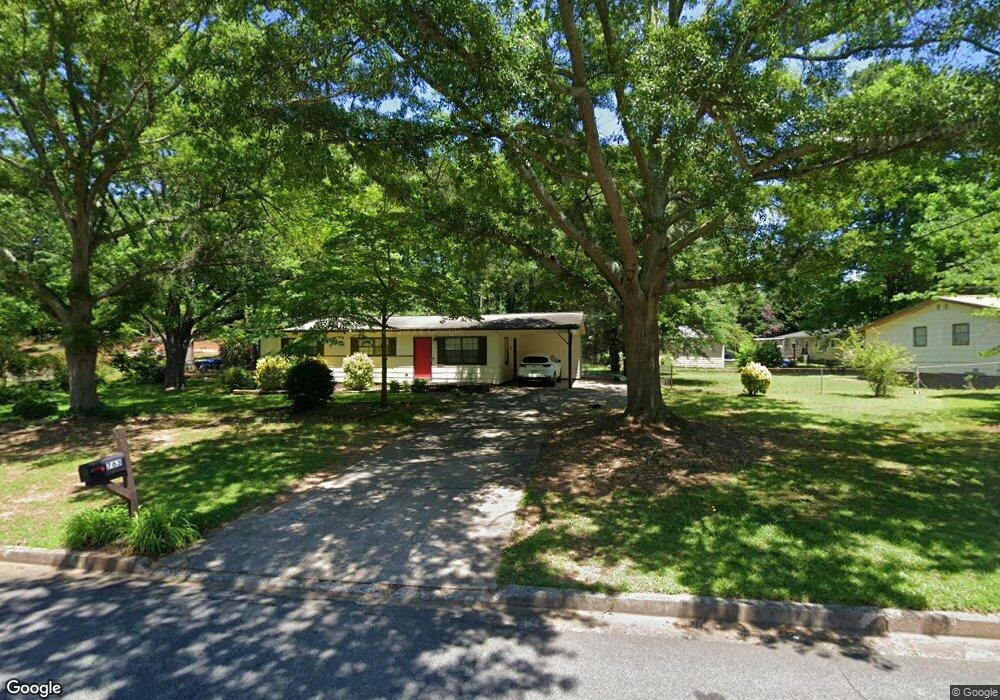
763 Gettysburg Trail NE Unit 1 Kennesaw, GA 30144
Sandy Plains NeighborhoodEstimated Value: $199,000 - $299,000
3
Beds
1
Bath
1,056
Sq Ft
$245/Sq Ft
Est. Value
About This Home
This home is located at 763 Gettysburg Trail NE Unit 1, Kennesaw, GA 30144 and is currently estimated at $258,329, approximately $244 per square foot. 763 Gettysburg Trail NE Unit 1 is a home located in Cobb County with nearby schools including Nicholson Elementary School, McCleskey Middle School, and Kell High School.
Ownership History
Date
Name
Owned For
Owner Type
Purchase Details
Closed on
Jun 17, 2021
Sold by
Hester Lauren A
Bought by
Hester David
Current Estimated Value
Home Financials for this Owner
Home Financials are based on the most recent Mortgage that was taken out on this home.
Original Mortgage
$123,500
Outstanding Balance
$111,814
Interest Rate
2.9%
Mortgage Type
New Conventional
Estimated Equity
$146,515
Purchase Details
Closed on
Mar 31, 1998
Sold by
Ralston John H and Ralston Georgianna M
Bought by
Hester David C and Hester Lauren A
Home Financials for this Owner
Home Financials are based on the most recent Mortgage that was taken out on this home.
Original Mortgage
$60,439
Interest Rate
7.14%
Mortgage Type
FHA
Purchase Details
Closed on
Aug 9, 1996
Sold by
Egan William J Karmann
Bought by
Ralston John H Georgianna
Create a Home Valuation Report for This Property
The Home Valuation Report is an in-depth analysis detailing your home's value as well as a comparison with similar homes in the area
Home Values in the Area
Average Home Value in this Area
Purchase History
| Date | Buyer | Sale Price | Title Company |
|---|---|---|---|
| Hester David | $130,000 | None Available | |
| Hester David C | $62,000 | -- | |
| Ralston John H Georgianna | $58,000 | -- |
Source: Public Records
Mortgage History
| Date | Status | Borrower | Loan Amount |
|---|---|---|---|
| Open | Hester David | $123,500 | |
| Previous Owner | Hester David C | $60,439 | |
| Closed | Ralston John H Georgianna | $0 |
Source: Public Records
Tax History Compared to Growth
Tax History
| Year | Tax Paid | Tax Assessment Tax Assessment Total Assessment is a certain percentage of the fair market value that is determined by local assessors to be the total taxable value of land and additions on the property. | Land | Improvement |
|---|---|---|---|---|
| 2024 | $2,883 | $95,612 | $26,000 | $69,612 |
| 2023 | $2,289 | $75,928 | $22,000 | $53,928 |
| 2022 | $1,447 | $67,564 | $18,000 | $49,564 |
| 2021 | $1,105 | $51,984 | $14,000 | $37,984 |
| 2020 | $1,073 | $50,504 | $8,000 | $42,504 |
| 2019 | $1,073 | $50,504 | $8,000 | $42,504 |
| 2018 | $828 | $39,292 | $8,000 | $31,292 |
| 2017 | $800 | $39,292 | $8,000 | $31,292 |
| 2016 | $648 | $32,316 | $6,000 | $26,316 |
| 2015 | $572 | $28,248 | $6,000 | $22,248 |
| 2014 | $577 | $28,248 | $0 | $0 |
Source: Public Records
Map
Nearby Homes
- 785 Gettysburg Trail NE Unit 1
- 4646 Backwoods Ct NE
- 751 Gettysburg Trail NE
- 770 Gettysburg Trail NE Unit 1
- 780 Gettysburg Trail NE
- 760 Gettysburg Trail NE
- 4656 Backwoods Ct NE Unit 1
- 750 Gettysburg Trail NE Unit 1
- 4683 Rambling Rd NE Unit I
- 739 Gettysburg Trail NE
- 805 Gettysburg Trail NE
- 4687 Rambling Rd NE Unit 1
- 4666 Backwoods Ct NE
- 4693 Rambling Rd NE
- 4697 Backwoods Ct NE
- 740 Gettysburg Trail NE
- 4677 Rambling Rd NE Unit 1
- 751 Starmist Ct NE
- 800 Gettysburg Trail NE
- 747 Starmist Ct NE