763 Main St Worcester, MA 01610
Main South NeighborhoodEstimated Value: $358,877
About This Home
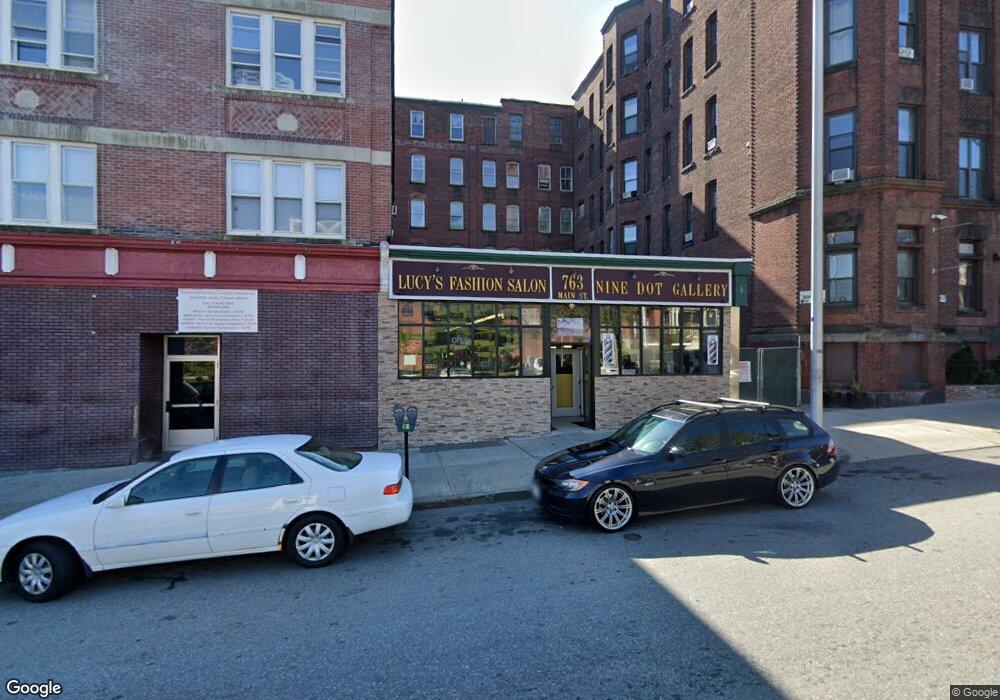
This home is located at 763 Main St, Worcester, MA 01610 and is currently estimated at $358,877, approximately $199 per square foot. 763 Main St is a home located in Worcester County with nearby schools including Jacob Hiatt Magnet School, Chandler Elementary Community School, and Chandler Magnet.
Ownership History
We collect this data history from publicly available records. To have your information removed, we recommend requesting removal directly through your county’s website.
Purchase Details
Purchase Details
Purchase Details
Purchase Details
Home Values in the Area
Average Home Value in this Area
Purchase History
We collect this data history from publicly available records. To have your information removed, we recommend requesting removal directly through your county’s website.
| Date | Buyer | Sale Price | Title Company |
|---|---|---|---|
| -- | None Available | ||
| $260,000 | None Available | ||
| -- | None Available | ||
| $117,000 | -- |
Tax History
We collect this data history from publicly available records. To have your information removed, we recommend requesting removal directly through your county’s website.
| Year | Tax Paid | Tax Assessment Tax Assessment Total Assessment is a certain percentage of the fair market value that is determined by local assessors to be the total taxable value of land and additions on the property. | Land | Improvement |
|---|---|---|---|---|
| 2025 | $5,979 | $209,000 | $52,400 | $156,600 |
| 2024 | $6,194 | $206,200 | $52,400 | $153,800 |
| 2023 | $5,817 | $186,100 | $45,500 | $140,600 |
| 2022 | $5,579 | $167,400 | $45,500 | $121,900 |
| 2021 | $6,983 | $192,900 | $34,700 | $158,200 |
| 2020 | $7,074 | $201,200 | $34,700 | $166,500 |
| 2019 | $6,990 | $200,300 | $33,800 | $166,500 |
| 2018 | $6,649 | $195,400 | $33,800 | $161,600 |
| 2017 | $6,276 | $190,600 | $33,800 | $156,800 |
| 2016 | $5,155 | $151,700 | $29,900 | $121,800 |
| 2015 | $4,813 | $151,700 | $29,900 | $121,800 |
| 2014 | $4,677 | $151,700 | $29,900 | $121,800 |
Map
- 6 Piedmont St
- 10 Lagrange St
- 4 Preston St
- 12 Oread St
- 295 Southbridge St
- 817 Main St
- 127 Austin St
- 70 Southbridge St Unit 811
- 70 Southbridge St Unit 313
- 70 Southbridge St Unit 310
- 128 Austin St
- 34 Irving St
- 29 Newbury St
- 29 Irving St Unit 8
- 4 Chatham Place Unit 3
- 5 Ripley Place
- 39 Woodland St
- 12 Crown St
- 5 Claremont St
- 200 Beacon St
- 1 Jackson St
- 5 Jackson St
- 765 Main St
- 765 Main St
- 761 Main St
- 7 Jackson St
- 751 Main St
- 12 Jackson St
- 315 Ave Nestor Olivas Unit Calle 25 y 26
- 739 Main St
- 24 Jackson St
- 9 Lagrange St
- 36 Jackson St
- 731 Main St
- 17 Hermon St
- 721 Main St
- 33 Hermon St Unit R-308
- 33 Hermon St Unit R-203
- 33 Hermon St Unit L-202
- 33 Hermon St Unit GL-1
Ask me questions while you tour the home.