Estimated Value: $296,000 - $343,000
3
Beds
2
Baths
900
Sq Ft
$349/Sq Ft
Est. Value
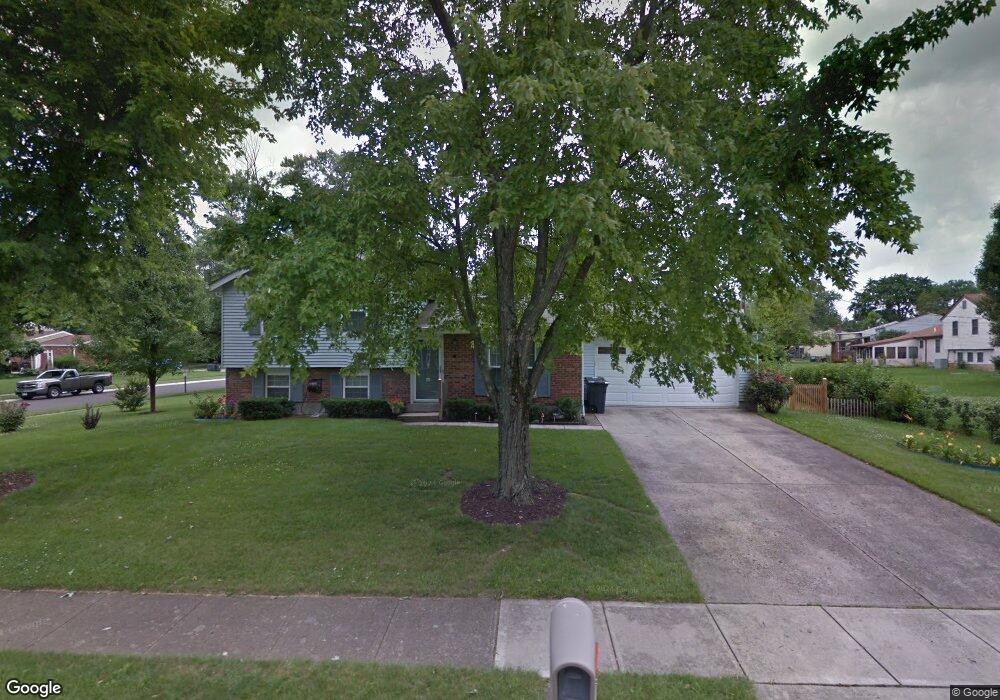
About This Home
This home is located at 763 Maplewood Ln, Mason, OH 45040 and is currently estimated at $314,354, approximately $349 per square foot. 763 Maplewood Ln is a home located in Warren County with nearby schools including Mason Intermediate Elementary School, Mason Middle School, and William Mason High School.
Ownership History
Date
Name
Owned For
Owner Type
Purchase Details
Closed on
Aug 28, 2015
Sold by
Vollmer Robert L
Bought by
Vollmer Robert L and Vollmer Vollmer
Current Estimated Value
Home Financials for this Owner
Home Financials are based on the most recent Mortgage that was taken out on this home.
Interest Rate
3.84%
Purchase Details
Closed on
Aug 26, 2003
Sold by
Cozine John C and Cozine Shannon D
Bought by
Vollmer Robert L and Vollmer Carol L
Home Financials for this Owner
Home Financials are based on the most recent Mortgage that was taken out on this home.
Original Mortgage
$91,000
Interest Rate
5.69%
Mortgage Type
Purchase Money Mortgage
Purchase Details
Closed on
Mar 16, 2001
Sold by
Oberle George
Bought by
Cozine John C and Graham Shannon D
Home Financials for this Owner
Home Financials are based on the most recent Mortgage that was taken out on this home.
Original Mortgage
$115,900
Interest Rate
7.13%
Mortgage Type
New Conventional
Create a Home Valuation Report for This Property
The Home Valuation Report is an in-depth analysis detailing your home's value as well as a comparison with similar homes in the area
Home Values in the Area
Average Home Value in this Area
Purchase History
| Date | Buyer | Sale Price | Title Company |
|---|---|---|---|
| Vollmer Robert L | -- | -- | |
| Vollmer Robert L | $136,000 | Land America | |
| Cozine John C | $122,385 | -- |
Source: Public Records
Mortgage History
| Date | Status | Borrower | Loan Amount |
|---|---|---|---|
| Closed | Vollmer Robert L | -- | |
| Previous Owner | Vollmer Robert L | $91,000 | |
| Previous Owner | Cozine John C | $115,900 |
Source: Public Records
Tax History
| Year | Tax Paid | Tax Assessment Tax Assessment Total Assessment is a certain percentage of the fair market value that is determined by local assessors to be the total taxable value of land and additions on the property. | Land | Improvement |
|---|---|---|---|---|
| 2025 | $2,597 | $73,800 | $24,500 | $49,300 |
| 2024 | $2,597 | $73,800 | $24,500 | $49,300 |
| 2023 | $2,196 | $54,467 | $10,762 | $43,704 |
| 2022 | $2,168 | $54,467 | $10,763 | $43,705 |
| 2021 | $2,053 | $54,467 | $10,763 | $43,705 |
| 2020 | $1,861 | $44,282 | $8,750 | $35,532 |
| 2019 | $1,711 | $44,282 | $8,750 | $35,532 |
| 2018 | $1,717 | $44,282 | $8,750 | $35,532 |
| 2017 | $1,525 | $38,199 | $8,274 | $29,925 |
| 2016 | $1,570 | $38,199 | $8,274 | $29,925 |
| 2015 | $1,574 | $38,199 | $8,274 | $29,925 |
| 2014 | $1,544 | $35,700 | $7,730 | $27,970 |
| 2013 | $1,548 | $40,410 | $8,750 | $31,660 |
Source: Public Records
Map
Nearby Homes
- 792 Majken Place
- 1475 St Lawrence Dr
- 6300 Amber Ct
- 6411 Coverage Ct
- 6379 Coverage Ct
- 6404 Coverage Ct
- 6394 Coverage Ct
- 6382 Coverage Ct
- 6378 Coverage Ct
- 6375 Coverage Ct
- 6364 Coverage Ct
- 6354 Coverage Ct
- 899 Tradewind Dr
- 6358 Coverage Ct
- 6403 Nicholas Way
- 6393 Nicholas Way
- 6361 Coverage Ct
- 6179 Nicholas Way
- 6175 Nicholas Way
- 6171 Nicholas Way
- 1420 Baymeadows Dr
- 1415 Hillary Ln
- 1424 Baymeadows Dr
- 1419 Hillary Ln
- 1408 Baymeadows Dr
- 768 Maplewood Ln
- 1419 Baymeadows Dr
- 1415 Baymeadows Dr
- 776 Majken Place
- 764 Maplewood Ln
- 1428 Baymeadows Dr
- 1411 Baymeadows Dr
- 1423 Hillary Ln
- 760 Maplewood Ln
- 1407 Baymeadows Dr
- 1432 Baymeadows Dr
- 1427 Hillary Ln
- 751 Maplewood Ln
- 1431 Baymeadows Dr
- 742 Anthony Ln
Your Personal Tour Guide
Ask me questions while you tour the home.