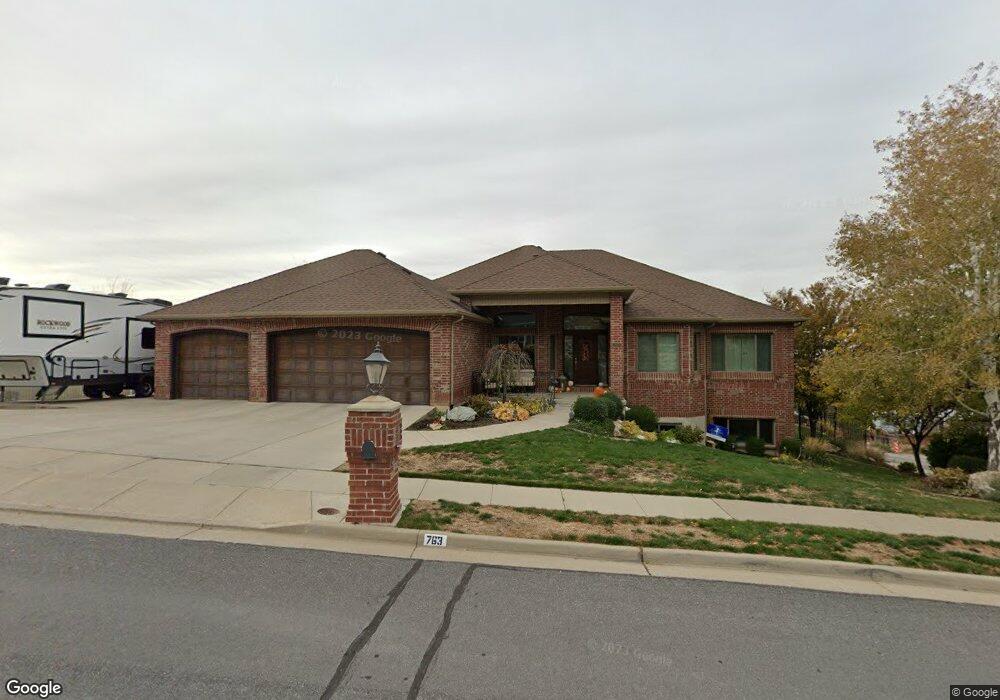
763 N 700 E Centerville, UT 84014
Estimated Value: $720,000 - $883,000
--
Bed
3
Baths
2,305
Sq Ft
$343/Sq Ft
Est. Value
About This Home
This home is located at 763 N 700 E, Centerville, UT 84014 and is currently estimated at $790,226, approximately $342 per square foot. 763 N 700 E is a home located in Davis County with nearby schools including Centerville Elementary, Centerville Jr High, and Viewmont High School.
Ownership History
Date
Name
Owned For
Owner Type
Purchase Details
Closed on
Nov 1, 2010
Sold by
Reynolds Tricia L
Bought by
Creamer Tyson and Creamer Danielle L
Current Estimated Value
Purchase Details
Closed on
Jun 27, 2007
Sold by
Reynolds Tricia L
Bought by
Reynolds Tricia L
Purchase Details
Closed on
Jan 19, 2005
Sold by
Reynolds Tricia Lynn
Bought by
Reynolds Tricia L
Purchase Details
Closed on
Aug 17, 2001
Sold by
Coldham Hall Lc
Bought by
Reynolds Tricia Lynn
Home Financials for this Owner
Home Financials are based on the most recent Mortgage that was taken out on this home.
Original Mortgage
$328,000
Interest Rate
7.75%
Mortgage Type
Construction
Create a Home Valuation Report for This Property
The Home Valuation Report is an in-depth analysis detailing your home's value as well as a comparison with similar homes in the area
Purchase History
| Date | Buyer | Sale Price | Title Company |
|---|---|---|---|
| Creamer Tyson | -- | Advanced Title Ins Ag S | |
| Reynolds Tricia L | -- | Bonneville Superior Title Co | |
| Reynolds Tricia L | -- | Accommodation | |
| Reynolds Tricia L | -- | -- | |
| Reynolds Tricia Lynn | -- | Aspen Title Insurance Agency |
Source: Public Records
Mortgage History
| Date | Status | Borrower | Loan Amount |
|---|---|---|---|
| Previous Owner | Reynolds Tricia Lynn | $328,000 |
Source: Public Records
Tax History
| Year | Tax Paid | Tax Assessment Tax Assessment Total Assessment is a certain percentage of the fair market value that is determined by local assessors to be the total taxable value of land and additions on the property. | Land | Improvement |
|---|---|---|---|---|
| 2025 | $752 | $463,650 | $174,973 | $288,677 |
| 2024 | $262 | $442,750 | $160,269 | $282,481 |
| 2023 | $4,750 | $835,000 | $271,280 | $563,720 |
| 2022 | $4,892 | $473,550 | $137,820 | $335,730 |
| 2021 | $783 | $688,000 | $215,047 | $472,953 |
| 2020 | $4,199 | $633,000 | $207,675 | $425,325 |
| 2019 | $4,130 | $608,000 | $200,393 | $407,607 |
| 2018 | $3,891 | $566,000 | $185,527 | $380,473 |
| 2016 | $3,329 | $269,115 | $66,700 | $202,415 |
| 2015 | $3,604 | $274,890 | $66,700 | $208,190 |
| 2014 | $3,252 | $253,729 | $66,700 | $187,029 |
| 2013 | -- | $206,381 | $55,993 | $150,388 |
Source: Public Records
Map
Nearby Homes
- 984 N 500 E
- 295 E 500 N
- 380 E 400 N
- 563 N 220 E
- 252 N 400 E
- 1290 Oakridge Dr
- 66 Brookside Ln
- 775 Pheasantbrook Cir
- 1366 Cottonwood Dr
- 360 E Center St
- 328 E 1100 S
- 16 S 200 E
- 56 W 200 N
- 282 W 605 N Unit A
- 282 W 605 N Unit I
- 281 W 650 N Unit B
- 292 W 680 N
- 303 W 650 N Unit I
- 132 W 200 N
- 781 Pheasantbrook Dr
Your Personal Tour Guide
Ask me questions while you tour the home.