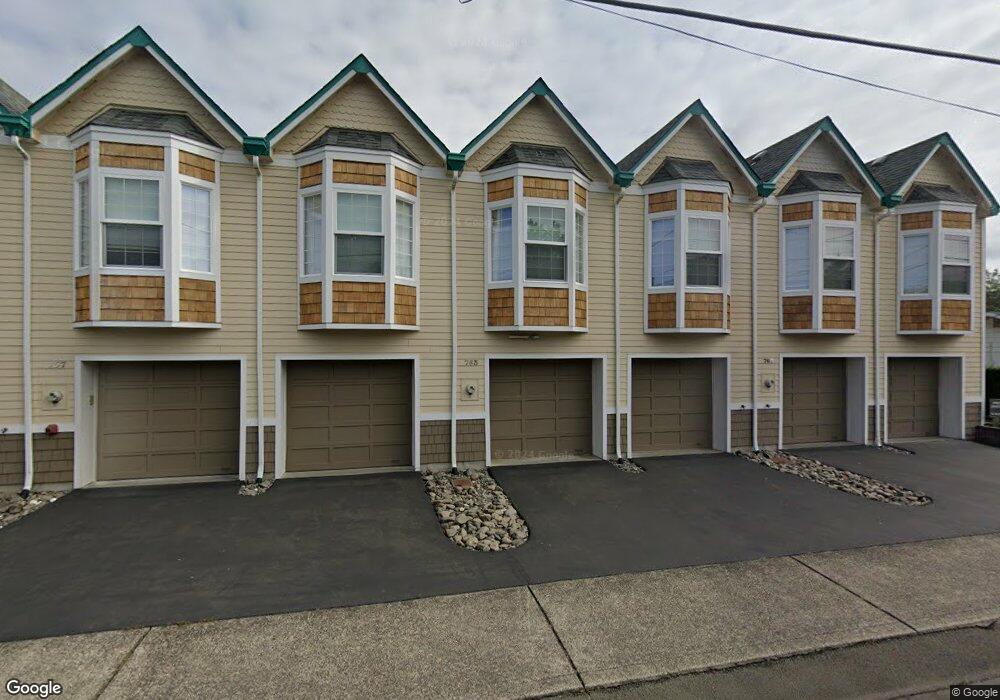
763 S Edgewood St Unit 3 Seaside, OR 97138
Estimated Value: $394,000 - $541,000
2
Beds
3
Baths
1,191
Sq Ft
$382/Sq Ft
Est. Value
About This Home
This home is located at 763 S Edgewood St Unit 3, Seaside, OR 97138 and is currently estimated at $454,644, approximately $381 per square foot. 763 S Edgewood St Unit 3 is a home located in Clatsop County with nearby schools including Seaside High School.
Ownership History
Date
Name
Owned For
Owner Type
Purchase Details
Closed on
Jan 29, 2025
Sold by
Grosz Barbara
Bought by
Grosz Revocable Trust and Grosz
Current Estimated Value
Purchase Details
Closed on
May 26, 2020
Sold by
Hopp Nancy M
Bought by
Grosz Barbara
Home Financials for this Owner
Home Financials are based on the most recent Mortgage that was taken out on this home.
Original Mortgage
$192,000
Interest Rate
3.3%
Mortgage Type
New Conventional
Purchase Details
Closed on
Jan 9, 2017
Sold by
Wiersig Darlene M
Bought by
Hopp Nancy M
Purchase Details
Closed on
Jul 30, 2007
Sold by
Hailey Paul E and Hailey Lois D
Bought by
Wiersig Darlene M
Home Financials for this Owner
Home Financials are based on the most recent Mortgage that was taken out on this home.
Original Mortgage
$100,000
Interest Rate
6.62%
Mortgage Type
Purchase Money Mortgage
Create a Home Valuation Report for This Property
The Home Valuation Report is an in-depth analysis detailing your home's value as well as a comparison with similar homes in the area
Home Values in the Area
Average Home Value in this Area
Purchase History
| Date | Buyer | Sale Price | Title Company |
|---|---|---|---|
| Grosz Revocable Trust | -- | None Listed On Document | |
| Grosz Barbara | $274,000 | Ticor Title Company Of Or | |
| Hopp Nancy M | $258,000 | -- | |
| Wiersig Darlene M | $290,000 | Fidelity National Title Co |
Source: Public Records
Mortgage History
| Date | Status | Borrower | Loan Amount |
|---|---|---|---|
| Previous Owner | Grosz Barbara | $192,000 | |
| Previous Owner | Wiersig Darlene M | $100,000 |
Source: Public Records
Tax History Compared to Growth
Tax History
| Year | Tax Paid | Tax Assessment Tax Assessment Total Assessment is a certain percentage of the fair market value that is determined by local assessors to be the total taxable value of land and additions on the property. | Land | Improvement |
|---|---|---|---|---|
| 2025 | $4,464 | $310,651 | -- | -- |
| 2024 | $4,333 | $301,604 | -- | -- |
| 2023 | $4,205 | $292,820 | $0 | $0 |
| 2022 | $4,090 | $284,292 | $0 | $0 |
| 2021 | $3,916 | $276,013 | $0 | $0 |
| 2020 | $3,706 | $267,975 | $0 | $0 |
| 2019 | $3,596 | $260,361 | $0 | $0 |
| 2018 | $3,690 | $255,211 | $0 | $0 |
| 2017 | $3,437 | $247,779 | $0 | $0 |
| 2016 | $2,890 | $240,563 | $78,058 | $162,505 |
| 2015 | $3,054 | $244,558 | $56,017 | $188,541 |
| 2014 | $3,070 | $237,436 | $0 | $0 |
| 2013 | -- | $230,521 | $0 | $0 |
Source: Public Records
Map
Nearby Homes
- 870 S Holladay Dr Unit 3
- 870 S Holladay Dr
- 500 Farrell Ct
- 1061 S Columbia St
- 720 740 Avenue G
- 1041 Beach Dr
- 1108 S Holladay Dr Unit 14
- 1108 S Holladay Dr Unit 24
- 860 Beach Dr
- 1041 S Beach Dr SW
- 720 Avenue G
- 15 Avenue I
- 15 Avenue I Unit 1
- 301 C Ave Unit 301
- 301 C Ave
- TL 8700 Prom St
- 1081 S Prom
- 1281 S Downing St
- 475 S Prom Unit 114
- 475 S Prom Unit 518
- 763 S Edgewood St
- 751 S Edgewood St
- 823 S Edgewood St
- 780 S Edgewood St
- 771 S Edgewood St Unit 6
- 771 S Edgewood St
- 779 S Edgewood St
- 779 S Edgewood St Unit 8
- 760 S Edgewood St
- 445 Avenue G Unit 402
- 445 Avenue G Unit 302
- 445 Avenue G Unit 202
- 445 Avenue G Unit 304
- 445 Avenue G Unit 204
- 445 Avenue G Unit 303
- 445 Avenue G Unit 403
- 445 Avenue G Unit 301
- 445 Avenue G Unit 203
- 445 Avenue G Unit 404
- 445 Ave G #302 Unit 302 (Photos of 303)