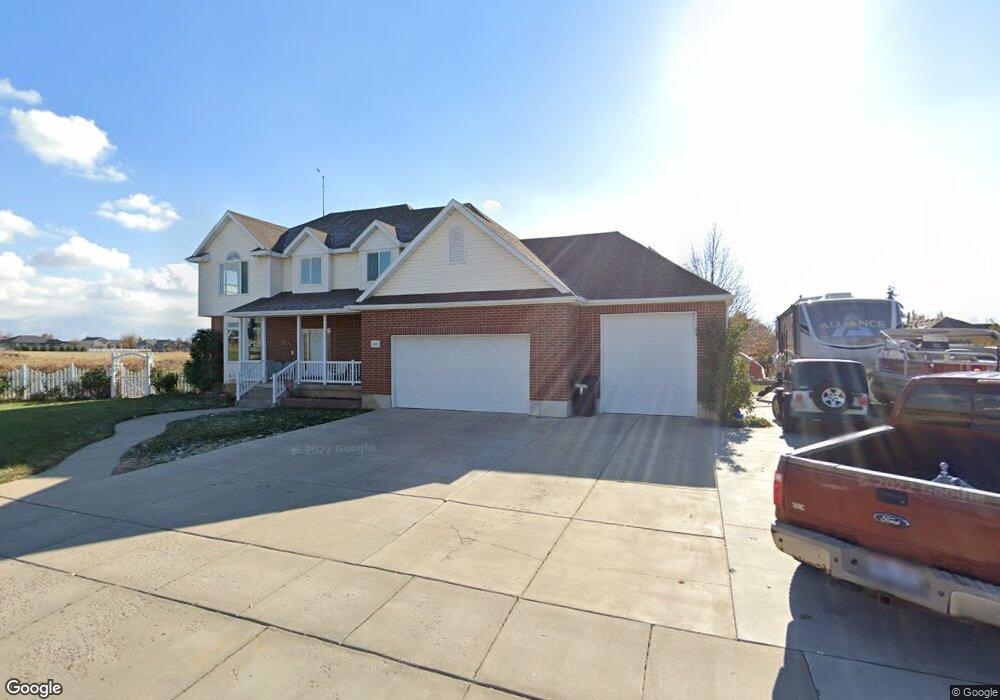
763 W 3150 S Syracuse, UT 84075
Estimated Value: $700,242 - $769,000
5
Beds
3
Baths
2,606
Sq Ft
$283/Sq Ft
Est. Value
About This Home
This home is located at 763 W 3150 S, Syracuse, UT 84075 and is currently estimated at $738,561, approximately $283 per square foot. 763 W 3150 S is a home located in Davis County with nearby schools including Bluff Ridge Elementary, Legacy Junior High School, and Clearfield High School.
Ownership History
Date
Name
Owned For
Owner Type
Purchase Details
Closed on
Jul 29, 1999
Sold by
K Star Homes & Construction Lc
Bought by
Thompson Michael C and Thompson Michelle W
Current Estimated Value
Home Financials for this Owner
Home Financials are based on the most recent Mortgage that was taken out on this home.
Original Mortgage
$224,900
Outstanding Balance
$63,395
Interest Rate
7.64%
Estimated Equity
$675,166
Purchase Details
Closed on
Mar 16, 1999
Sold by
Silver Lake Estates Llc
Bought by
K Star Homes & Construction Lc
Home Financials for this Owner
Home Financials are based on the most recent Mortgage that was taken out on this home.
Original Mortgage
$8,515
Interest Rate
6.73%
Mortgage Type
Seller Take Back
Create a Home Valuation Report for This Property
The Home Valuation Report is an in-depth analysis detailing your home's value as well as a comparison with similar homes in the area
Home Values in the Area
Average Home Value in this Area
Purchase History
| Date | Buyer | Sale Price | Title Company |
|---|---|---|---|
| Thompson Michael C | -- | Guardian Title Company | |
| K Star Homes & Construction Lc | -- | Bonneville Title Company Inc |
Source: Public Records
Mortgage History
| Date | Status | Borrower | Loan Amount |
|---|---|---|---|
| Open | Thompson Michael C | $224,900 | |
| Previous Owner | K Star Homes & Construction Lc | $8,515 |
Source: Public Records
Tax History Compared to Growth
Tax History
| Year | Tax Paid | Tax Assessment Tax Assessment Total Assessment is a certain percentage of the fair market value that is determined by local assessors to be the total taxable value of land and additions on the property. | Land | Improvement |
|---|---|---|---|---|
| 2025 | $3,643 | $351,451 | $135,823 | $215,628 |
| 2024 | $3,511 | $341,000 | $123,624 | $217,376 |
| 2023 | $3,396 | $601,000 | $171,578 | $429,422 |
| 2022 | $3,622 | $351,450 | $97,161 | $254,289 |
| 2021 | $3,083 | $463,000 | $144,907 | $318,093 |
| 2020 | $2,771 | $403,000 | $120,486 | $282,514 |
| 2019 | $2,661 | $382,000 | $124,832 | $257,168 |
| 2018 | $2,681 | $382,000 | $116,718 | $265,282 |
| 2016 | $2,399 | $179,245 | $44,541 | $134,704 |
| 2015 | $2,452 | $174,515 | $44,541 | $129,974 |
| 2014 | $2,355 | $170,790 | $44,541 | $126,249 |
| 2013 | -- | $161,696 | $43,821 | $117,875 |
Source: Public Records
Map
Nearby Homes
- 967 W Yamada Ct
- 3169 S 550 W
- 1139 W 3150 S
- 803 W 2800 S
- 567 W 3575 S
- 454 N 3550 W
- 3263 W 850 N
- 2766 S 1200 W
- 3528 S Finch St
- 2958 S 1320 W
- 697 N 3275 W
- 3067 S Old Emigrant Rd Unit B
- 2784 S 1720 W Unit F
- 3637 S Creek Side Ln
- 1137 W 2500 S
- 101 S 3600 W
- 475 W 2400 S
- 2480 S 1150 W
- 1546 W Parkview Dr
- 3391 W 1125 N