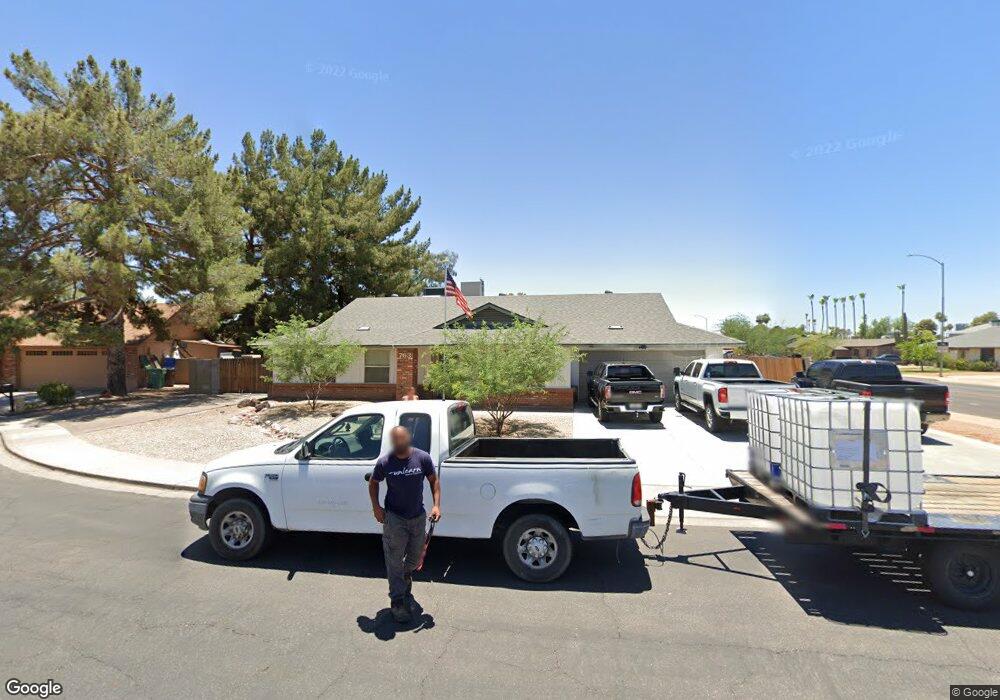
763 W Nido Cir Mesa, AZ 85210
Dobson NeighborhoodEstimated Value: $433,203 - $492,000
3
Beds
3
Baths
1,774
Sq Ft
$265/Sq Ft
Est. Value
About This Home
This home is located at 763 W Nido Cir, Mesa, AZ 85210 and is currently estimated at $469,551, approximately $264 per square foot. 763 W Nido Cir is a home located in Maricopa County with nearby schools including Crismon Elementary School, Franklin at Brimhall Elementary School, and Franklin Accelerated Academy Jordan Campus.
Ownership History
Date
Name
Owned For
Owner Type
Purchase Details
Closed on
Jun 2, 2003
Sold by
Drake Jerry and Drake Katrina
Bought by
Busha Jon T and Busha Kristin L
Current Estimated Value
Home Financials for this Owner
Home Financials are based on the most recent Mortgage that was taken out on this home.
Original Mortgage
$130,050
Outstanding Balance
$56,679
Interest Rate
5.71%
Mortgage Type
New Conventional
Estimated Equity
$412,872
Purchase Details
Closed on
Feb 28, 2000
Sold by
Drake Jerry
Bought by
Drake Jerry and Drake Katrina
Purchase Details
Closed on
Jan 25, 2000
Sold by
Drake Katrina
Bought by
Drake Jerry
Purchase Details
Closed on
Jan 22, 2000
Sold by
Harkcom Brian L and Harkcom Brian Lee
Bought by
Drake Jerry
Create a Home Valuation Report for This Property
The Home Valuation Report is an in-depth analysis detailing your home's value as well as a comparison with similar homes in the area
Home Values in the Area
Average Home Value in this Area
Purchase History
| Date | Buyer | Sale Price | Title Company |
|---|---|---|---|
| Busha Jon T | $144,500 | First American Title Ins Co | |
| Drake Jerry | -- | Grand Canyon Title Agency In | |
| Drake Jerry | -- | Grand Canyon Title Agency In | |
| Drake Jerry | $117,000 | Grand Canyon Title Agency In |
Source: Public Records
Mortgage History
| Date | Status | Borrower | Loan Amount |
|---|---|---|---|
| Open | Busha Jon T | $130,050 |
Source: Public Records
Tax History Compared to Growth
Tax History
| Year | Tax Paid | Tax Assessment Tax Assessment Total Assessment is a certain percentage of the fair market value that is determined by local assessors to be the total taxable value of land and additions on the property. | Land | Improvement |
|---|---|---|---|---|
| 2025 | $1,730 | $20,827 | -- | -- |
| 2024 | $1,748 | $19,835 | -- | -- |
| 2023 | $1,748 | $37,350 | $7,470 | $29,880 |
| 2022 | $1,710 | $28,270 | $5,650 | $22,620 |
| 2021 | $1,757 | $26,520 | $5,300 | $21,220 |
| 2020 | $1,734 | $24,050 | $4,810 | $19,240 |
| 2019 | $1,606 | $21,900 | $4,380 | $17,520 |
| 2018 | $1,533 | $20,180 | $4,030 | $16,150 |
| 2017 | $1,485 | $19,060 | $3,810 | $15,250 |
| 2016 | $1,458 | $18,560 | $3,710 | $14,850 |
| 2015 | $1,377 | $16,660 | $3,330 | $13,330 |
Source: Public Records
Map
Nearby Homes
- 629 W Navarro Ave
- 945 W Mendoza Ave
- 653 W Guadalupe Rd Unit 2005
- 653 W Guadalupe Rd Unit 2019
- 1005 W Madero Ave
- 2834 S Extension Rd Unit 1031
- 643 W Medina Ave
- 1114 W Meseto Ave
- 623 W Guadalupe Rd Unit 214
- 623 W Guadalupe Rd Unit 171
- 623 W Guadalupe Rd Unit 254
- 2522 S Spruce
- 507 W Navarro Ave
- 3011 S Extension Rd
- 1160 W Madero Cir
- 416 W Nido Cir
- 533 W Guadalupe Rd Unit 1122
- 533 W Guadalupe Rd Unit 2032
- 533 W Guadalupe Rd Unit 1001
- 906 W Kiowa Ave
- 755 W Nido Cir
- 762 W Natal Cir
- 754 W Natal Cir
- 2624 S Extension Rd
- 764 W Nido Cir
- 748 W Nido Cir
- 2616 S Extension Rd
- 2632 S Extension Rd
- 756 W Nido Cir
- 746 W Natal Cir
- 805 W Monte Ave
- 2640 S Extension Rd
- 746 W Nido Cir
- 2621 S Westwood
- 817 W Monte Ave
- 2629 S Westwood
- 2588 S Extension Rd Unit 261
- 2588 S Extension Rd Unit 257
- 2588 S Extension Rd
- 2613 S Westwood