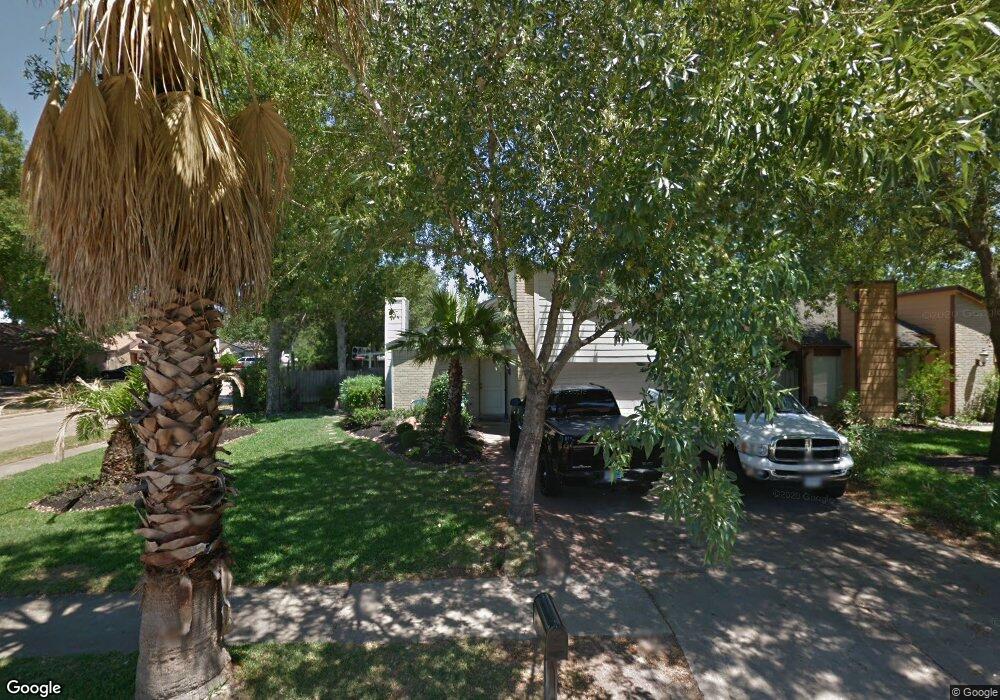
7634 Log Cradle Dr Houston, TX 77041
Hearthstone NeighborhoodEstimated Value: $194,000 - $211,000
3
Beds
2
Baths
1,178
Sq Ft
$172/Sq Ft
Est. Value
About This Home
This home is located at 7634 Log Cradle Dr, Houston, TX 77041 and is currently estimated at $202,453, approximately $171 per square foot. 7634 Log Cradle Dr is a home located in Harris County with nearby schools including Hairgrove Elementary School, Labay Middle School, and Cypress Falls High School.
Ownership History
Date
Name
Owned For
Owner Type
Purchase Details
Closed on
Nov 26, 1997
Sold by
Carlson Tommy R and Carlson Lisa G
Bought by
Tobon Higinio Huerta
Current Estimated Value
Home Financials for this Owner
Home Financials are based on the most recent Mortgage that was taken out on this home.
Original Mortgage
$47,500
Outstanding Balance
$8,015
Interest Rate
7.2%
Mortgage Type
Purchase Money Mortgage
Estimated Equity
$194,438
Purchase Details
Closed on
Jul 23, 1997
Sold by
Copeland Jeff
Bought by
Carlson Tommy R and Carlson Lisa G
Home Financials for this Owner
Home Financials are based on the most recent Mortgage that was taken out on this home.
Original Mortgage
$47,500
Interest Rate
12%
Mortgage Type
Seller Take Back
Purchase Details
Closed on
Feb 18, 1997
Sold by
Hud
Bought by
Copeland Jeff
Create a Home Valuation Report for This Property
The Home Valuation Report is an in-depth analysis detailing your home's value as well as a comparison with similar homes in the area
Home Values in the Area
Average Home Value in this Area
Purchase History
| Date | Buyer | Sale Price | Title Company |
|---|---|---|---|
| Tobon Higinio Huerta | -- | -- | |
| Carlson Tommy R | -- | -- | |
| Copeland Jeff | -- | -- |
Source: Public Records
Mortgage History
| Date | Status | Borrower | Loan Amount |
|---|---|---|---|
| Open | Tobon Higinio Huerta | $47,500 | |
| Previous Owner | Carlson Tommy R | $47,500 |
Source: Public Records
Tax History
| Year | Tax Paid | Tax Assessment Tax Assessment Total Assessment is a certain percentage of the fair market value that is determined by local assessors to be the total taxable value of land and additions on the property. | Land | Improvement |
|---|---|---|---|---|
| 2025 | $398 | $195,221 | $74,403 | $120,818 |
| 2024 | $398 | $210,175 | $74,403 | $135,772 |
| 2023 | $398 | $194,272 | $53,468 | $140,804 |
| 2022 | $4,166 | $171,084 | $41,021 | $130,063 |
| 2021 | $4,006 | $142,496 | $41,021 | $101,475 |
| 2020 | $3,868 | $132,262 | $29,705 | $102,557 |
| 2019 | $3,710 | $124,775 | $21,173 | $103,602 |
| 2018 | $929 | $114,950 | $21,173 | $93,777 |
| 2017 | $3,077 | $107,197 | $21,173 | $86,024 |
| 2016 | $2,797 | $97,099 | $21,173 | $75,926 |
| 2015 | $1,857 | $84,035 | $14,036 | $69,999 |
| 2014 | $1,857 | $77,683 | $8,802 | $68,881 |
Source: Public Records
Map
Nearby Homes
- 13330 Chimney Sweep Dr
- 7619 Lemma Dr
- 7606 Pepperbrook Dr
- 7607 Stamen Dr
- 7530 Lemma Dr
- 7607 Brookleaf Dr
- 13210 Chimney Sweep Dr
- 7914 Ingle Oak Dr
- 13606 Short Brook Ln
- 13323 Firebrick Dr
- 7415 Fountaincrest Dr
- 7439 Kite Hill Dr
- 7915 Fall Hollow Dr
- 7530 Millbrae Ln
- 7315 Weatherhill Ln
- 13202 Chasworth Dr
- 13907 Flagstone Dr
- 13811 Brannon Field Ln
- 7923 Split Cypress Ln
- 13826 Swan Hollow Ln
- 7630 Log Cradle Dr
- 7626 Log Cradle Dr
- 7635 Pepperbrook Dr
- 7631 Pepperbrook Dr
- 7622 Log Cradle Dr
- 7627 Pepperbrook Dr
- 13338 Chimney Sweep Dr
- 13334 Chimney Sweep Dr
- 7635 Log Cradle Dr
- 7631 Log Cradle Dr
- 7623 Pepperbrook Dr
- 7618 Log Cradle Dr
- 13326 Chimney Sweep Dr
- 7627 Log Cradle Dr
- 13402 Chimney Sweep Dr
- 7623 Log Cradle Dr
- 7619 Pepperbrook Dr
- 13322 Chimney Sweep Dr
- 7614 Log Cradle Dr
- 7619 Log Cradle Dr
Your Personal Tour Guide
Ask me questions while you tour the home.