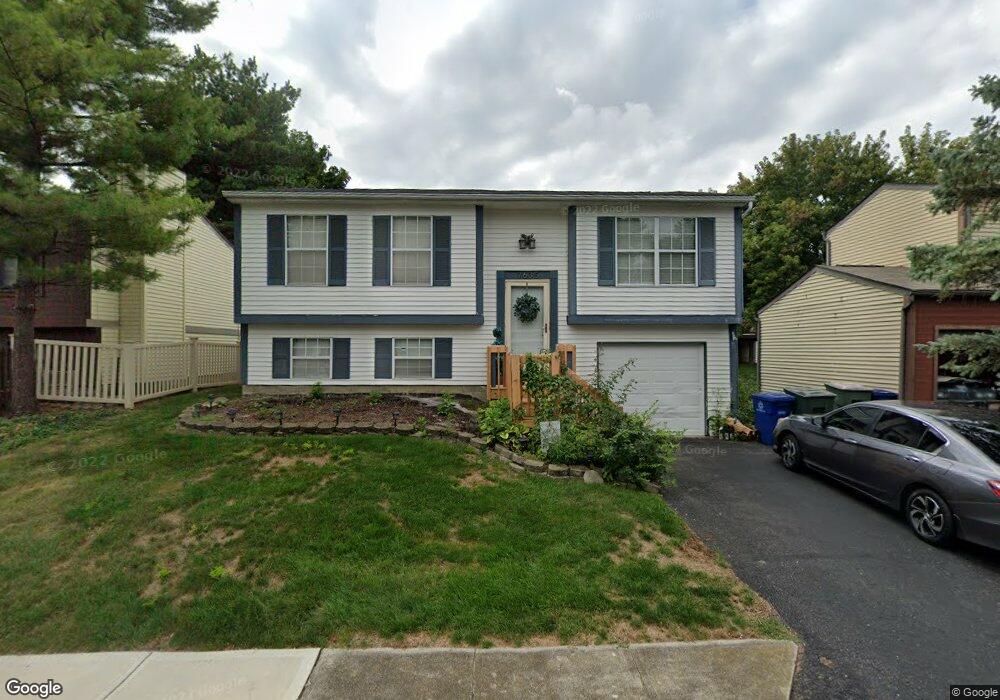
7635 Charlesway Dr Unit 91 Worthington, OH 43085
Slate Hill NeighborhoodEstimated Value: $272,000 - $293,000
3
Beds
2
Baths
1,350
Sq Ft
$208/Sq Ft
Est. Value
About This Home
This home is located at 7635 Charlesway Dr Unit 91, Worthington, OH 43085 and is currently estimated at $281,256, approximately $208 per square foot. 7635 Charlesway Dr Unit 91 is a home located in Franklin County with nearby schools including Slate Hill Elementary School, Worthingway Middle School, and Thomas Worthington High School.
Ownership History
Date
Name
Owned For
Owner Type
Purchase Details
Closed on
Apr 27, 2001
Sold by
Dayne Shick and Dayne Jennifer S
Bought by
Upshaw Michelle R
Current Estimated Value
Home Financials for this Owner
Home Financials are based on the most recent Mortgage that was taken out on this home.
Original Mortgage
$92,250
Outstanding Balance
$40,444
Interest Rate
9.41%
Mortgage Type
Purchase Money Mortgage
Estimated Equity
$240,812
Purchase Details
Closed on
May 5, 2000
Sold by
Prater Vunita Sue
Bought by
Shick Dayne and Shick Jennifer S
Home Financials for this Owner
Home Financials are based on the most recent Mortgage that was taken out on this home.
Original Mortgage
$90,450
Interest Rate
8.24%
Mortgage Type
Purchase Money Mortgage
Purchase Details
Closed on
Apr 21, 1994
Bought by
Prater Vunita S
Purchase Details
Closed on
Oct 3, 1990
Purchase Details
Closed on
Sep 26, 1986
Create a Home Valuation Report for This Property
The Home Valuation Report is an in-depth analysis detailing your home's value as well as a comparison with similar homes in the area
Home Values in the Area
Average Home Value in this Area
Purchase History
| Date | Buyer | Sale Price | Title Company |
|---|---|---|---|
| Upshaw Michelle R | $102,500 | Chicago Title West | |
| Shick Dayne | $93,900 | Chicago Title | |
| Prater Vunita S | $70,000 | -- | |
| -- | $66,500 | -- | |
| -- | $57,400 | -- |
Source: Public Records
Mortgage History
| Date | Status | Borrower | Loan Amount |
|---|---|---|---|
| Open | Upshaw Michelle R | $92,250 | |
| Previous Owner | Shick Dayne | $90,450 |
Source: Public Records
Tax History Compared to Growth
Tax History
| Year | Tax Paid | Tax Assessment Tax Assessment Total Assessment is a certain percentage of the fair market value that is determined by local assessors to be the total taxable value of land and additions on the property. | Land | Improvement |
|---|---|---|---|---|
| 2024 | $4,255 | $69,300 | $12,950 | $56,350 |
| 2023 | $4,069 | $69,300 | $12,950 | $56,350 |
| 2022 | $3,346 | $45,220 | $7,140 | $38,080 |
| 2021 | $3,087 | $45,220 | $7,140 | $38,080 |
| 2020 | $2,973 | $45,220 | $7,140 | $38,080 |
| 2019 | $2,747 | $37,700 | $5,950 | $31,750 |
| 2018 | $2,712 | $37,700 | $5,950 | $31,750 |
| 2017 | $2,612 | $37,700 | $5,950 | $31,750 |
| 2016 | $2,763 | $38,920 | $5,670 | $33,250 |
| 2015 | $2,764 | $38,920 | $5,670 | $33,250 |
| 2014 | $2,763 | $38,920 | $5,670 | $33,250 |
| 2013 | $1,446 | $40,950 | $5,950 | $35,000 |
Source: Public Records
Map
Nearby Homes
- 994 Annagladys Dr Unit M4
- 7685 Whitneyway Dr Unit 17
- 7649 Flynnway Dr Unit 139
- 7634 Kelvinway Dr Unit 150
- 1026 Snohomish Ave
- 7736 Garrison Dr Unit 242
- 906 Linkfield Dr
- 874 Sheldrake Ct Unit 21C
- 1133 Tillicum Dr
- 940 Larkfield Dr
- 7697 Barkwood Dr Unit 1D
- 874 Charnwood Ln Unit 5D
- 7803 Barkwood Dr Unit 11C
- 1223 Tranquil Dr
- 1158 Worthington Woods Blvd
- 1222 Clement Dr
- 7889 Woodhouse Ln Unit 44B
- 716 Alta View Ct Unit 33
- 842 Soramill Ln Unit 46C
- 1291 Worthington Creek Dr Unit 7
- 7629 Charlesway Dr
- 7641 Charlesway Dr Unit 92
- 7638 Sessis Dr
- 7644 Sessis Dr Unit 111
- 7626 Charlesway Dr
- 7634 Charlesway Dr
- 7634 Charlesway Dr Unit 94
- 7647 Charlesway Dr Unit 98
- 7632 Sessis Dr Unit 109
- 7628 Charlesway Dr Unit 93
- 7640 Charlesway Dr Unit 95
- 7615 Charlesway Dr Unit 89
- 7652 Sessis Dr Unit 112
- 7646 Charlesway Dr
- 7646 Charlesway Dr Unit 96
- 7620 Sessis Dr
- 7653 Charlesway Dr Unit 99
- 7620 Charlesway Dr Unit 86
- 7641 Sessis Dr Unit 107
- 7652 Charlesway Dr