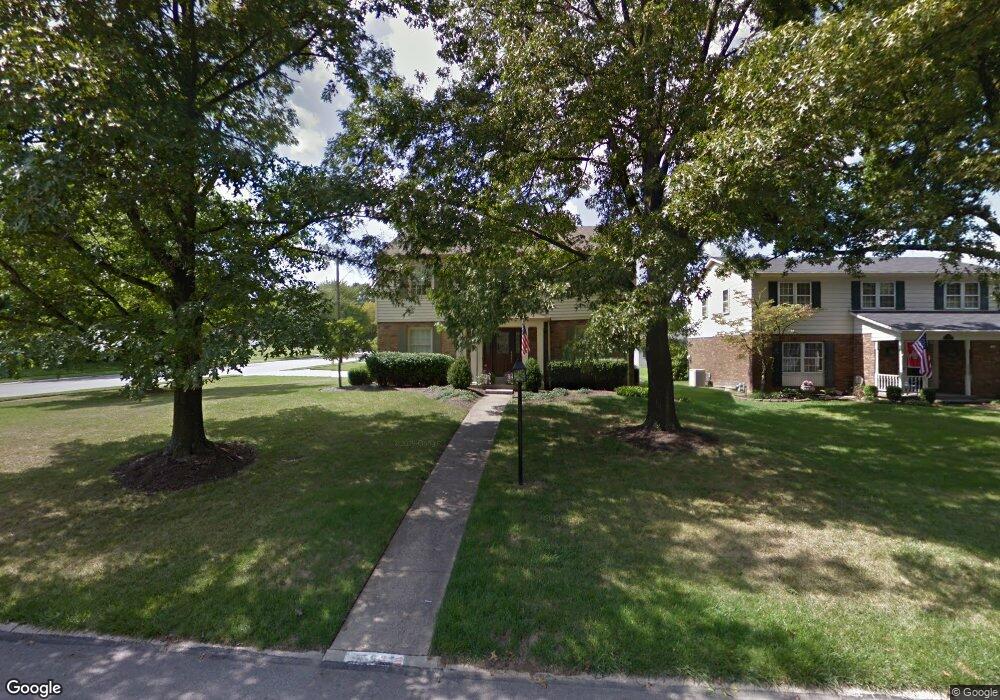
7635 Ginnala Ct Cincinnati, OH 45243
Estimated Value: $518,088 - $609,000
4
Beds
3
Baths
2,291
Sq Ft
$250/Sq Ft
Est. Value
About This Home
This home is located at 7635 Ginnala Ct, Cincinnati, OH 45243 and is currently estimated at $573,522, approximately $250 per square foot. 7635 Ginnala Ct is a home located in Hamilton County with nearby schools including Indian Hill Primary School, Indian Hill Elementary School, and Indian Hill Middle School.
Ownership History
Date
Name
Owned For
Owner Type
Purchase Details
Closed on
Oct 1, 2020
Sold by
Baele John D and Hinsch Suzanne Bade
Bought by
Deters Allison and Deters Jonathan
Current Estimated Value
Home Financials for this Owner
Home Financials are based on the most recent Mortgage that was taken out on this home.
Original Mortgage
$300,000
Outstanding Balance
$263,894
Interest Rate
2.8%
Mortgage Type
New Conventional
Estimated Equity
$309,628
Purchase Details
Closed on
Sep 29, 2020
Sold by
Baele John D
Bought by
Hinsch Suzanne Baele and Baele John D
Home Financials for this Owner
Home Financials are based on the most recent Mortgage that was taken out on this home.
Original Mortgage
$300,000
Outstanding Balance
$263,894
Interest Rate
2.8%
Mortgage Type
New Conventional
Estimated Equity
$309,628
Purchase Details
Closed on
Sep 23, 2020
Sold by
Baele Rosemary C
Bought by
Baele John D
Home Financials for this Owner
Home Financials are based on the most recent Mortgage that was taken out on this home.
Original Mortgage
$300,000
Outstanding Balance
$263,894
Interest Rate
2.8%
Mortgage Type
New Conventional
Estimated Equity
$309,628
Purchase Details
Closed on
Nov 10, 2015
Sold by
Baele John E and Baele Rosemary C
Bought by
Baele Rosemary C
Create a Home Valuation Report for This Property
The Home Valuation Report is an in-depth analysis detailing your home's value as well as a comparison with similar homes in the area
Home Values in the Area
Average Home Value in this Area
Purchase History
| Date | Buyer | Sale Price | Title Company |
|---|---|---|---|
| Deters Allison | $375,000 | Springdale Title Llc | |
| Hinsch Suzanne Baele | -- | None Available | |
| Baele John D | -- | None Available | |
| Baele Rosemary C | -- | -- |
Source: Public Records
Mortgage History
| Date | Status | Borrower | Loan Amount |
|---|---|---|---|
| Open | Deters Allison | $300,000 |
Source: Public Records
Tax History
| Year | Tax Paid | Tax Assessment Tax Assessment Total Assessment is a certain percentage of the fair market value that is determined by local assessors to be the total taxable value of land and additions on the property. | Land | Improvement |
|---|---|---|---|---|
| 2025 | $5,269 | $131,251 | $32,253 | $98,998 |
| 2023 | $5,160 | $131,251 | $32,253 | $98,998 |
| 2022 | $5,636 | $117,373 | $22,061 | $95,312 |
| 2021 | $5,491 | $117,373 | $22,061 | $95,312 |
| 2020 | $4,531 | $117,373 | $22,061 | $95,312 |
| 2019 | $4,213 | $102,960 | $19,352 | $83,608 |
| 2018 | $4,222 | $102,960 | $19,352 | $83,608 |
| 2017 | $4,020 | $102,960 | $19,352 | $83,608 |
| 2016 | $3,751 | $95,988 | $17,612 | $78,376 |
| 2015 | $3,784 | $95,988 | $17,612 | $78,376 |
| 2014 | $3,761 | $95,988 | $17,612 | $78,376 |
| 2013 | $3,693 | $91,417 | $16,772 | $74,645 |
Source: Public Records
Map
Nearby Homes
- 7300 N Mingo Ln
- 7321 Hosbrook Rd
- 7159 Hosbrook Rd
- 7503 S Timberlane Dr
- 7220 Mar Del Dr
- 7151 Euclid Ave
- 7317 Euclid Ave
- 7133 Fowler Ave
- 7280 E Galbraith Rd
- 7274 E Galbraith Rd
- 7817 Locust Ln
- 7156 Maple Ave
- 7752 Montgomery Rd
- 7231 Berwood Dr
- 6752 Rose Crest Ave
- 7406 Dawson Rd
- 5760 Kugler Mill Rd
- 7831 Euclid Ave
- 7474 Dawson Rd
- 7834 Laurel Ave
- 7645 Ginnala Ct
- 7657 Ginnala Ct
- 7640 Ginnala Ct
- 7011 Lynnfield Ct
- 7630 Ginnala Ct
- 7652 Ginnala Ct
- 7667 Ginnala Ct
- 7604 Tiki Dr
- 7662 Ginnala Ct
- 7586 Tiki Dr
- 7679 Ginnala Ct
- 7674 Ginnala Ct
- 6995 Lynnfield Ct
- 7190 Lynnfield Ct
- 7651 Hosbrook Rd
- 7605 Tiki Dr
- 7671 Hosbrook Rd
- 7570 Tiki Dr
- 7684 Ginnala Ct
- 7691 Hosbrook Rd
Your Personal Tour Guide
Ask me questions while you tour the home.