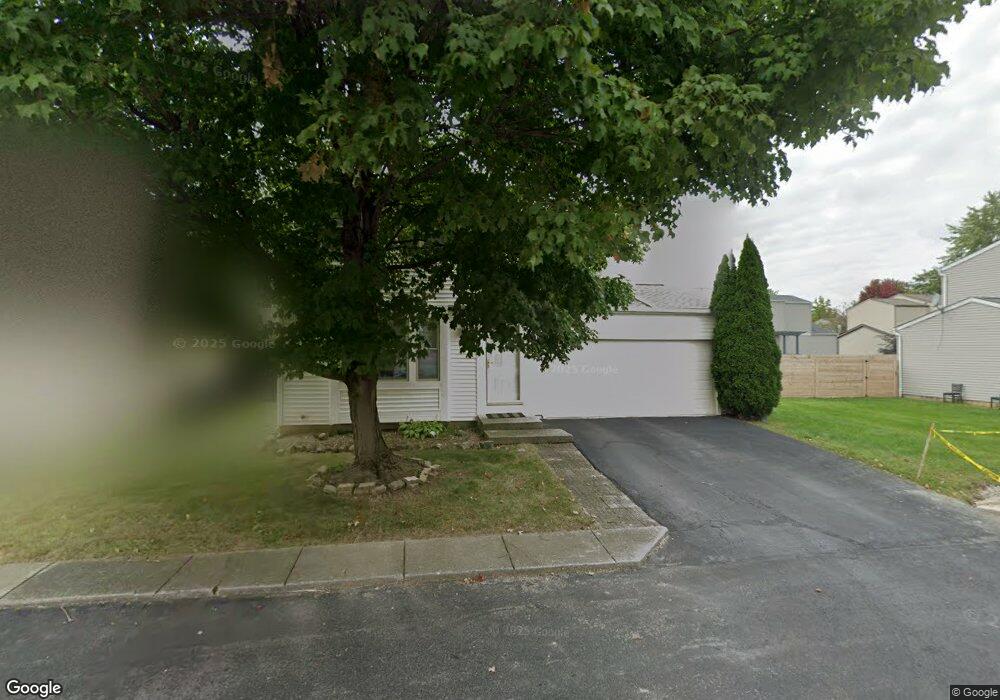
7637 Kelvinway Dr Unit 153 Columbus, OH 43085
Slate Hill NeighborhoodEstimated Value: $277,215 - $305,000
3
Beds
2
Baths
1,212
Sq Ft
$238/Sq Ft
Est. Value
About This Home
This home is located at 7637 Kelvinway Dr Unit 153, Columbus, OH 43085 and is currently estimated at $288,554, approximately $238 per square foot. 7637 Kelvinway Dr Unit 153 is a home located in Franklin County with nearby schools including Worthington Estates Elementary School, Worthingway Middle School, and Thomas Worthington High School.
Ownership History
Date
Name
Owned For
Owner Type
Purchase Details
Closed on
Jul 24, 2009
Sold by
Johnson Kyle R and Johnson Karen
Bought by
Johnson Karen
Current Estimated Value
Home Financials for this Owner
Home Financials are based on the most recent Mortgage that was taken out on this home.
Original Mortgage
$96,000
Outstanding Balance
$62,144
Interest Rate
5.15%
Mortgage Type
New Conventional
Estimated Equity
$226,410
Purchase Details
Closed on
Jul 15, 1998
Sold by
Dickson Mark A and Dickson Julie A
Bought by
Ferguson Walter N and Ferguson Tracy L
Purchase Details
Closed on
Apr 17, 1996
Sold by
Wisneski Judith A
Bought by
Dickson Mark A and Dickson Julie
Home Financials for this Owner
Home Financials are based on the most recent Mortgage that was taken out on this home.
Original Mortgage
$63,000
Interest Rate
7.44%
Mortgage Type
New Conventional
Purchase Details
Closed on
Jun 4, 1992
Create a Home Valuation Report for This Property
The Home Valuation Report is an in-depth analysis detailing your home's value as well as a comparison with similar homes in the area
Home Values in the Area
Average Home Value in this Area
Purchase History
| Date | Buyer | Sale Price | Title Company |
|---|---|---|---|
| Johnson Karen | -- | Independent | |
| Ferguson Walter N | $90,900 | Chicago Title | |
| Dickson Mark A | $82,900 | -- | |
| -- | -- | -- |
Source: Public Records
Mortgage History
| Date | Status | Borrower | Loan Amount |
|---|---|---|---|
| Open | Johnson Karen | $96,000 | |
| Previous Owner | Dickson Mark A | $63,000 |
Source: Public Records
Tax History Compared to Growth
Tax History
| Year | Tax Paid | Tax Assessment Tax Assessment Total Assessment is a certain percentage of the fair market value that is determined by local assessors to be the total taxable value of land and additions on the property. | Land | Improvement |
|---|---|---|---|---|
| 2024 | $4,898 | $79,770 | $12,950 | $66,820 |
| 2023 | $4,683 | $79,765 | $12,950 | $66,815 |
| 2022 | $4,045 | $54,670 | $7,140 | $47,530 |
| 2021 | $3,732 | $54,670 | $7,140 | $47,530 |
| 2020 | $3,595 | $54,670 | $7,140 | $47,530 |
| 2019 | $3,320 | $45,570 | $5,950 | $39,620 |
| 2018 | $3,162 | $45,570 | $5,950 | $39,620 |
| 2017 | $2,975 | $45,570 | $5,950 | $39,620 |
| 2016 | $3,107 | $43,760 | $6,270 | $37,490 |
| 2015 | $3,107 | $43,760 | $6,270 | $37,490 |
| 2014 | $3,106 | $43,760 | $6,270 | $37,490 |
| 2013 | $1,626 | $46,025 | $6,580 | $39,445 |
Source: Public Records
Map
Nearby Homes
- 910 Annagladys Dr Unit G2
- 7634 Kelvinway Dr Unit 150
- 7685 Whitneyway Dr Unit 17
- 796 Timber Way Dr Unit 15B
- 7697 Barkwood Dr Unit 1D
- 7415 Cayman Ln Unit 7415
- 737 Plant Dr Unit 2-C
- 716 Alta View Ct Unit 33
- 1090 Landings Loop Unit 36
- 696 Keys View Ct Unit 77
- 7416 Sancus Blvd
- 7850 Malton Ln Unit 14E
- 874 Charnwood Ln Unit 5D
- 580 Mawyer Dr Unit 132
- 1158 Worthington Woods Blvd
- 1212 Tillicum Dr
- 1291 Worthington Creek Dr Unit 7
- 7981 Oakwind Ct
- 7916 Sudeley Ct
- 889 Pelham Ct
- 7631 Kelvinway Dr Unit 152
- 7656 Garrison Dr
- 7653 Kelvinway Dr
- 7653 Kelvinway Dr Unit 154
- 7660 Garrison Dr
- 7660 Garrison Dr Unit 181
- 7628 Kelvinway Dr Unit 149
- 7625 Kelvinway Dr
- 7625 Kelvinway Dr Unit 151
- 7664 Garrison Dr Unit 182
- 7646 Kelvinway Dr Unit 157
- 7659 Kelvinway Dr Unit 155
- 855 Cutlip Dr
- 7622 Kelvinway Dr Unit 148
- 7652 Kelvinway Dr Unit 158
- 7668 Garrison Dr Unit 183
- 851 Cutlip Dr Unit 176
- 7657 Garrison Dr
- 7657 Garrison Dr Unit 178
- 878 Annagladys Dr Unit E4