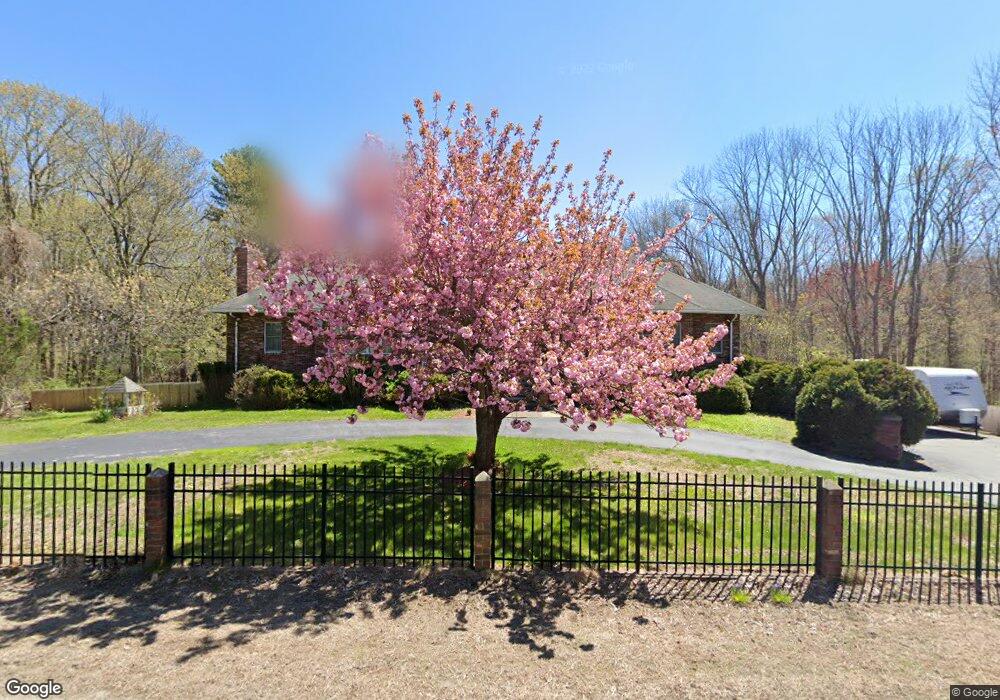
764 Johnson St North Andover, MA 01845
Estimated Value: $1,247,156 - $1,498,000
4
Beds
3
Baths
6,106
Sq Ft
$223/Sq Ft
Est. Value
About This Home
This home is located at 764 Johnson St, North Andover, MA 01845 and is currently estimated at $1,358,789, approximately $222 per square foot. 764 Johnson St is a home located in Essex County with nearby schools including Annie L Sargent Elementary School, North Andover Middle School, and North Andover High School.
Ownership History
Date
Name
Owned For
Owner Type
Purchase Details
Closed on
May 4, 1999
Sold by
Cascio Rosario
Bought by
Cascio Giovanni R
Current Estimated Value
Home Financials for this Owner
Home Financials are based on the most recent Mortgage that was taken out on this home.
Original Mortgage
$150,000
Interest Rate
6.95%
Mortgage Type
Purchase Money Mortgage
Purchase Details
Closed on
Mar 31, 1989
Sold by
Carter Wm R
Bought by
Cascio Rosario
Create a Home Valuation Report for This Property
The Home Valuation Report is an in-depth analysis detailing your home's value as well as a comparison with similar homes in the area
Home Values in the Area
Average Home Value in this Area
Purchase History
| Date | Buyer | Sale Price | Title Company |
|---|---|---|---|
| Cascio Giovanni R | $187,500 | -- | |
| Cascio Rosario | $103,000 | -- |
Source: Public Records
Mortgage History
| Date | Status | Borrower | Loan Amount |
|---|---|---|---|
| Open | Cascio Rosario | $257,000 | |
| Closed | Cascio Rosario | $248,000 | |
| Closed | Cascio Rosario | $150,000 |
Source: Public Records
Tax History
| Year | Tax Paid | Tax Assessment Tax Assessment Total Assessment is a certain percentage of the fair market value that is determined by local assessors to be the total taxable value of land and additions on the property. | Land | Improvement |
|---|---|---|---|---|
| 2025 | $11,731 | $1,041,800 | $414,300 | $627,500 |
| 2024 | $10,900 | $982,900 | $392,500 | $590,400 |
| 2023 | $10,399 | $849,600 | $331,500 | $518,100 |
| 2022 | $10,355 | $765,300 | $287,900 | $477,400 |
| 2021 | $9,974 | $703,900 | $261,800 | $442,100 |
| 2020 | $9,279 | $675,300 | $255,200 | $420,100 |
| 2019 | $9,056 | $675,300 | $255,200 | $420,100 |
| 2018 | $9,812 | $675,300 | $255,200 | $420,100 |
| 2017 | $10,156 | $711,200 | $224,600 | $486,600 |
| 2016 | $9,562 | $670,100 | $226,800 | $443,300 |
| 2015 | $8,648 | $601,000 | $213,400 | $387,600 |
Source: Public Records
Map
Nearby Homes
- 73 Holly Ridge Rd
- 991 Johnson St
- 61 Abbott St
- 674 Salem St
- 445 Salem St
- 36 Kieran Rd
- 71 Regency Place
- 224 Raleigh Tavern Ln
- 335 Salem St
- 124 Quail Run Rd
- 136 Quail Run Rd
- 50 Boxford St
- 88 Johnson St
- 94 Boxford St
- 42 Hewitt Ave
- 38 Hepatica Dr Unit 36
- 122 Forest St
- 37 Sullivan St
- 204 Coventry Ln
- 3 Great Pond Rd
- 743 Johnson St
- 731 Johnson St
- 755 Johnson St
- 719 Johnson St
- 767 Johnson St
- 707 Johnson St
- 695 Johnson St
- 777 Johnson St
- 797 Johnson St
- 800 Johnson St
- 795 Johnson St
- 693 Johnson St
- 805 Johnson St
- 808 Johnson St
- 671 Johnson St
- 68 Ridge Way
- 100 Cricket Ln
- 6 Skyview Terrace
- 6 Skyview Terrace
- 60 Ridge Way
Your Personal Tour Guide
Ask me questions while you tour the home.