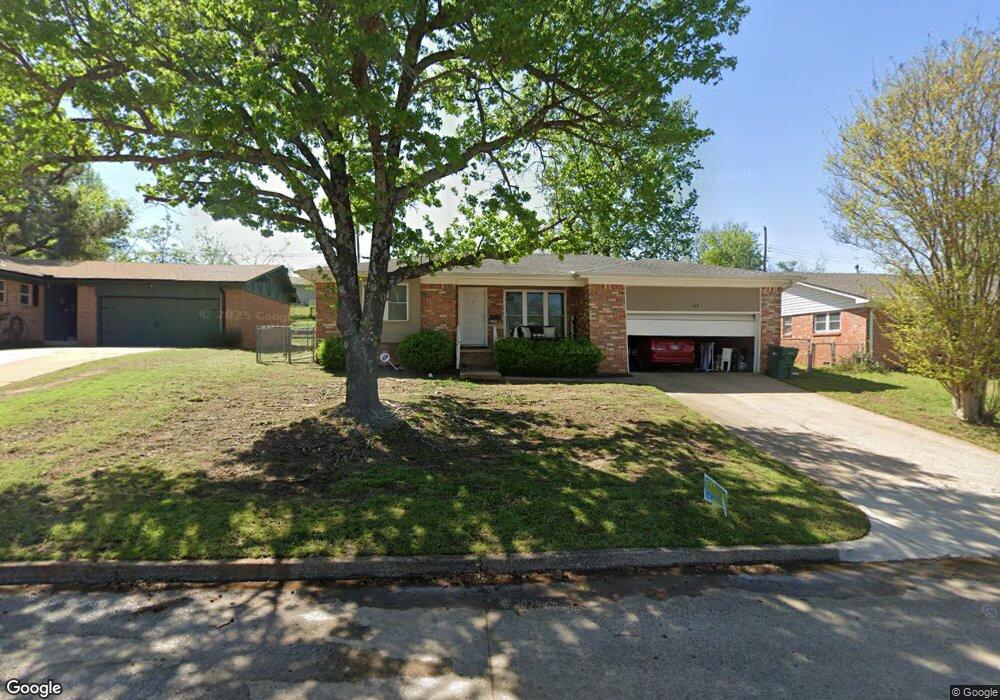
764 N Moccasin Place Sapulpa, OK 74066
Estimated Value: $201,000 - $216,000
3
Beds
2
Baths
1,367
Sq Ft
$151/Sq Ft
Est. Value
About This Home
This home is located at 764 N Moccasin Place, Sapulpa, OK 74066 and is currently estimated at $206,532, approximately $151 per square foot. 764 N Moccasin Place is a home located in Creek County with nearby schools including Sapulpa Junior High School, Sapulpa Middle School, and Sapulpa High School.
Ownership History
Date
Name
Owned For
Owner Type
Purchase Details
Closed on
Oct 23, 2020
Sold by
Rei Nation Llc
Bought by
Dobroski Nicholas
Current Estimated Value
Home Financials for this Owner
Home Financials are based on the most recent Mortgage that was taken out on this home.
Original Mortgage
$112,500
Outstanding Balance
$100,063
Interest Rate
2.9%
Mortgage Type
New Conventional
Estimated Equity
$106,469
Purchase Details
Closed on
Aug 5, 2020
Sold by
Lynch Ebony and Lynch Malcolm Anthony
Bought by
Rei Nation Llc
Purchase Details
Closed on
Mar 27, 2020
Sold by
Lynch Ebony
Bought by
Lynch Ebony and Lynch Malcolm Anthony
Purchase Details
Closed on
Feb 12, 2015
Sold by
Bonilla Phillip P and Bonilla Brynn
Bought by
Lynch Ebony
Home Financials for this Owner
Home Financials are based on the most recent Mortgage that was taken out on this home.
Original Mortgage
$85,260
Interest Rate
3.78%
Mortgage Type
FHA
Create a Home Valuation Report for This Property
The Home Valuation Report is an in-depth analysis detailing your home's value as well as a comparison with similar homes in the area
Home Values in the Area
Average Home Value in this Area
Purchase History
| Date | Buyer | Sale Price | Title Company |
|---|---|---|---|
| Dobroski Nicholas | $150,000 | First American Title Ins Co | |
| Rei Nation Llc | $80,000 | Apex Title & Closing Svc Llc | |
| Lynch Ebony | -- | None Available | |
| Lynch Ebony | $100,666 | None Available |
Source: Public Records
Mortgage History
| Date | Status | Borrower | Loan Amount |
|---|---|---|---|
| Open | Dobroski Nicholas | $112,500 | |
| Previous Owner | Lynch Ebony | $85,260 |
Source: Public Records
Tax History Compared to Growth
Tax History
| Year | Tax Paid | Tax Assessment Tax Assessment Total Assessment is a certain percentage of the fair market value that is determined by local assessors to be the total taxable value of land and additions on the property. | Land | Improvement |
|---|---|---|---|---|
| 2025 | $2,550 | $22,022 | $6,300 | $15,722 |
| 2024 | $2,550 | $20,974 | $6,000 | $14,974 |
| 2023 | $2,550 | $19,975 | $6,000 | $13,975 |
| 2022 | $2,185 | $19,024 | $6,000 | $13,024 |
| 2021 | $2,150 | $18,118 | $6,000 | $12,118 |
| 2020 | $1,355 | $12,489 | $2,160 | $10,329 |
| 2019 | $1,346 | $12,359 | $2,160 | $10,199 |
| 2018 | $1,331 | $11,999 | $2,160 | $9,839 |
| 2017 | $1,324 | $11,999 | $2,160 | $9,839 |
| 2016 | $1,259 | $11,999 | $2,160 | $9,839 |
| 2015 | -- | $11,434 | $2,092 | $9,342 |
| 2014 | -- | $11,434 | $2,092 | $9,342 |
Source: Public Records
Map
Nearby Homes
- 758 N Moccasin Place
- 802 N Boyd Cir
- 1411 E Denton Ave
- 930 N Brown St
- 420 Shadow Ln
- 505 N Ross St
- 436 Foxwood Dr
- 0 Line St Unit 2546638
- 543 N Ridgeway St
- 1136 E Watchorn Ave
- 103 Woodview Ln
- 1137 E Perkins Ave
- 1137 E Watchorn Ave
- 6 Mayfield St
- 1136 E Mcleod Ave
- 1140 E Hobson Ave
- 1002 E Line Ave
- 912 N Linden St
- 1033 E Thompson Ave
- 1023 E Thompson Ave
- 768 N Moccasin Place
- 763 N Moccasin St
- 754 N Moccasin Place
- 767 N Moccasin St
- 757 N Moccasin St
- 773 N Moccasin St
- 761 N Moccasin Place
- 753 N Moccasin St
- 776 N Moccasin Place
- 748 N Moccasin Place
- 767 N Moccasin Place
- 757 N Moccasin Place
- 773 N Moccasin Place
- 753 N Moccasin Place
- 777 N Moccasin St
- 747 N Moccasin St
- 784 N Moccasin Place
- 744 N Moccasin Place
- 777 N Moccasin Place
- 747 N Moccasin Place