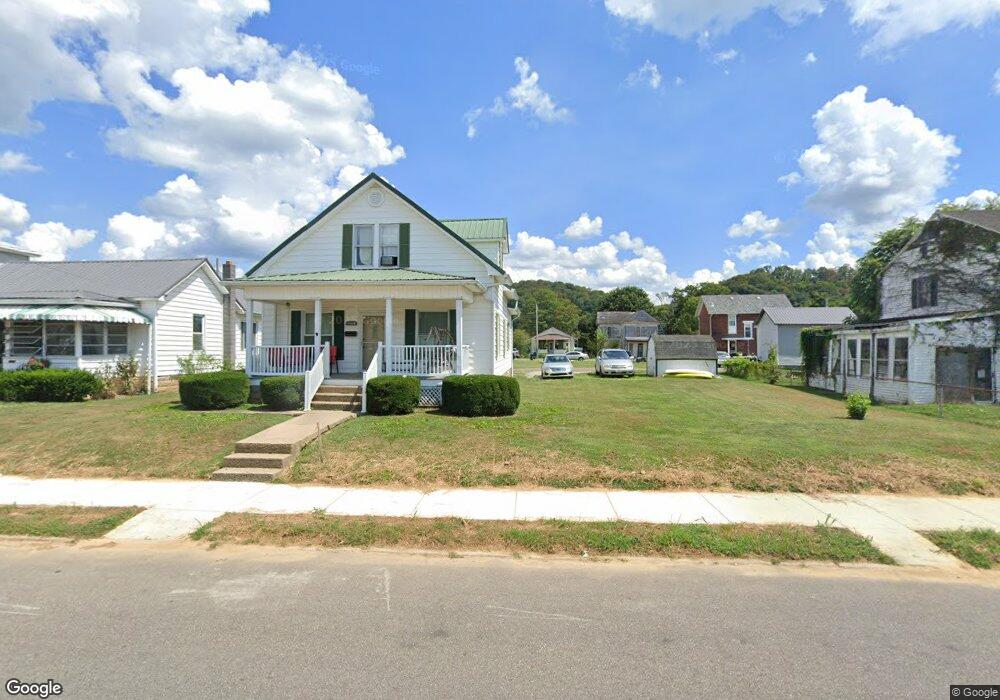
764 S 3rd Ave Middleport, OH 45760
Estimated Value: $68,000 - $110,000
4
Beds
1
Bath
1,085
Sq Ft
$76/Sq Ft
Est. Value
About This Home
This home is located at 764 S 3rd Ave, Middleport, OH 45760 and is currently estimated at $82,486, approximately $76 per square foot. 764 S 3rd Ave is a home located in Meigs County with nearby schools including Meigs Primary School, Meigs Intermediate School, and Meigs Middle School.
Ownership History
Date
Name
Owned For
Owner Type
Purchase Details
Closed on
Nov 20, 2023
Sold by
Wray Sean T
Bought by
Casci Ronald P
Current Estimated Value
Home Financials for this Owner
Home Financials are based on the most recent Mortgage that was taken out on this home.
Original Mortgage
$62,400
Outstanding Balance
$59,062
Interest Rate
7.76%
Mortgage Type
New Conventional
Estimated Equity
$23,424
Purchase Details
Closed on
Mar 5, 2020
Sold by
Schilling Sandra K
Bought by
Wray Sean T
Purchase Details
Closed on
Jul 17, 2013
Sold by
Clatworthy Dorothy
Bought by
Clatworthy Henry
Purchase Details
Closed on
Feb 27, 2013
Sold by
Schilling Sandra K and Clatworthy Sammy R
Bought by
Clatworthy Henry and Clatworthy Dorothy
Purchase Details
Closed on
Nov 8, 2011
Sold by
Clatworthy Henry and Clatworthy Dorothy
Bought by
Schilling Sandra K and Clatworthy Sammy R
Create a Home Valuation Report for This Property
The Home Valuation Report is an in-depth analysis detailing your home's value as well as a comparison with similar homes in the area
Purchase History
| Date | Buyer | Sale Price | Title Company |
|---|---|---|---|
| Casci Ronald P | $56,000 | None Listed On Document | |
| Casci Ronald P | $56,000 | None Listed On Document | |
| Wray Sean T | $52,000 | None Available | |
| Clatworthy Henry | -- | None Available | |
| Clatworthy Henry | -- | None Available | |
| Schilling Sandra K | -- | None Available |
Source: Public Records
Mortgage History
| Date | Status | Borrower | Loan Amount |
|---|---|---|---|
| Open | Casci Ronald P | $62,400 | |
| Closed | Casci Ronald P | $62,400 |
Source: Public Records
Tax History
| Year | Tax Paid | Tax Assessment Tax Assessment Total Assessment is a certain percentage of the fair market value that is determined by local assessors to be the total taxable value of land and additions on the property. | Land | Improvement |
|---|---|---|---|---|
| 2025 | $672 | $17,710 | $5,050 | $12,660 |
| 2024 | $672 | $13,180 | $4,350 | $8,830 |
| 2023 | $523 | $13,180 | $4,350 | $8,830 |
| 2022 | $506 | $13,180 | $4,350 | $8,830 |
| 2021 | $506 | $11,510 | $3,920 | $7,590 |
| 2020 | $510 | $11,510 | $3,920 | $7,590 |
| 2019 | $120 | $11,510 | $3,920 | $7,590 |
| 2018 | $39 | $9,660 | $2,610 | $7,050 |
| 2017 | $39 | $9,660 | $2,610 | $7,050 |
| 2016 | $39 | $9,660 | $2,610 | $7,050 |
| 2014 | $238 | $14,750 | $3,780 | $10,970 |
| 2013 | $238 | $14,750 | $3,780 | $10,970 |
Source: Public Records
Map
Nearby Homes
Your Personal Tour Guide
Ask me questions while you tour the home.