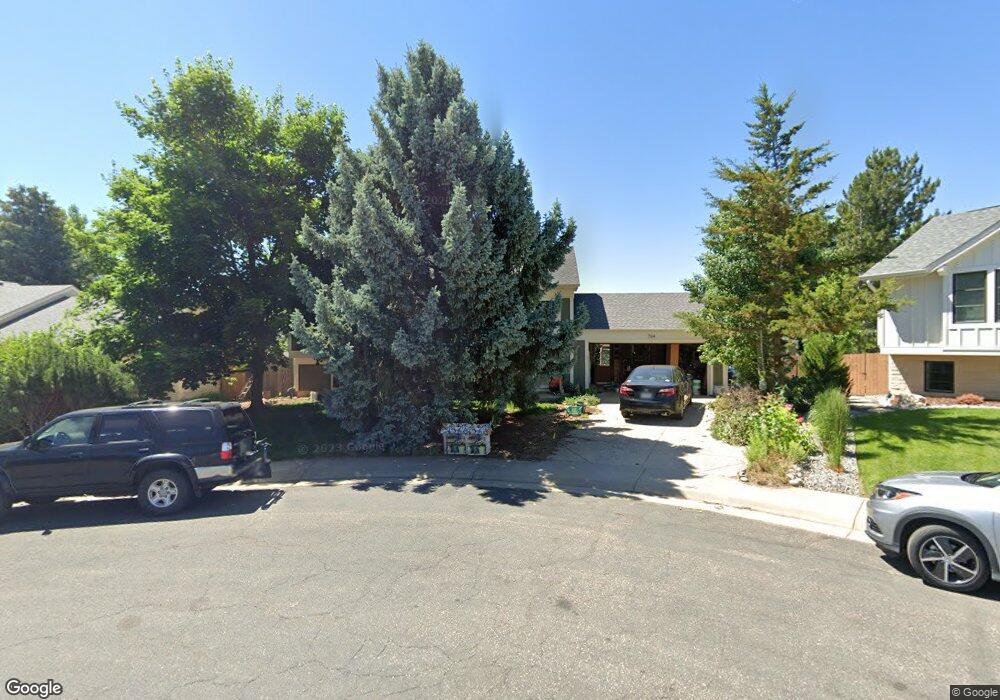
764 W Lois Ct Louisville, CO 80027
Estimated Value: $661,815 - $793,000
3
Beds
2
Baths
1,008
Sq Ft
$747/Sq Ft
Est. Value
About This Home
This home is located at 764 W Lois Ct, Louisville, CO 80027 and is currently estimated at $753,204, approximately $747 per square foot. 764 W Lois Ct is a home located in Boulder County with nearby schools including Fireside Elementary School, Monarch K-8 School, and Monarch High School.
Ownership History
Date
Name
Owned For
Owner Type
Purchase Details
Closed on
Nov 28, 2000
Sold by
Westdyke Stephanie and Westdyke Christopher R
Bought by
Needle Stanley and Needle Jonna
Current Estimated Value
Home Financials for this Owner
Home Financials are based on the most recent Mortgage that was taken out on this home.
Original Mortgage
$202,400
Outstanding Balance
$75,338
Interest Rate
7.84%
Estimated Equity
$677,866
Purchase Details
Closed on
Feb 18, 1994
Sold by
Crowsey Ricky C and Crowsey Rhonda J
Bought by
Westdyke Stephanie
Home Financials for this Owner
Home Financials are based on the most recent Mortgage that was taken out on this home.
Original Mortgage
$139,150
Interest Rate
6.62%
Purchase Details
Closed on
Jul 8, 1988
Bought by
Needle Stanley and Needle Jonna
Purchase Details
Closed on
Aug 4, 1987
Bought by
Needle Stanley and Needle Jonna
Create a Home Valuation Report for This Property
The Home Valuation Report is an in-depth analysis detailing your home's value as well as a comparison with similar homes in the area
Home Values in the Area
Average Home Value in this Area
Purchase History
| Date | Buyer | Sale Price | Title Company |
|---|---|---|---|
| Needle Stanley | $253,000 | -- | |
| Westdyke Stephanie | $146,500 | -- | |
| Needle Stanley | $95,000 | -- | |
| Needle Stanley | $98,000 | -- |
Source: Public Records
Mortgage History
| Date | Status | Borrower | Loan Amount |
|---|---|---|---|
| Open | Needle Stanley | $202,400 | |
| Previous Owner | Westdyke Stephanie | $139,150 | |
| Closed | Needle Stanley | $25,300 |
Source: Public Records
Tax History Compared to Growth
Tax History
| Year | Tax Paid | Tax Assessment Tax Assessment Total Assessment is a certain percentage of the fair market value that is determined by local assessors to be the total taxable value of land and additions on the property. | Land | Improvement |
|---|---|---|---|---|
| 2025 | $4,103 | $45,725 | $20,644 | $25,081 |
| 2024 | $4,103 | $45,725 | $20,644 | $25,081 |
| 2023 | $4,957 | $45,647 | $22,311 | $27,021 |
| 2022 | $4,438 | $35,966 | $16,388 | $19,578 |
| 2021 | $4,662 | $39,789 | $18,132 | $21,657 |
| 2020 | $4,339 | $35,922 | $14,658 | $21,264 |
| 2019 | $4,291 | $35,922 | $14,658 | $21,264 |
| 2018 | $3,663 | $30,060 | $9,864 | $20,196 |
| 2017 | $3,609 | $33,233 | $10,905 | $22,328 |
| 2016 | $3,586 | $29,651 | $11,860 | $17,791 |
| 2015 | $3,450 | $26,371 | $14,487 | $11,884 |
| 2014 | $3,232 | $26,371 | $14,487 | $11,884 |
Source: Public Records
Map
Nearby Homes
- 641 W Dahlia St
- 118 S Tanager Ct
- 279 S Taft Ct Unit 53
- 323 S Taft Ct Unit 26
- 284 S Taft Ct Unit 76
- 305 S Taft Ct Unit 33
- 159 S Polk Ave
- 812 W Mulberry St
- 362 S Taft Ct Unit 108
- 408 Fillmore Ct
- 494 Owl Dr Unit 4
- 749 Apple Ct
- 539 Coal Creek Ln
- 592 Spruce Cir
- 900 Eldorado Ln
- 546 Ridgeview Dr
- 810 Trail Ridge Dr
- 567 Manorwood Ln
- 590 Manorwood Ln N
- 572 Ridgeview Dr