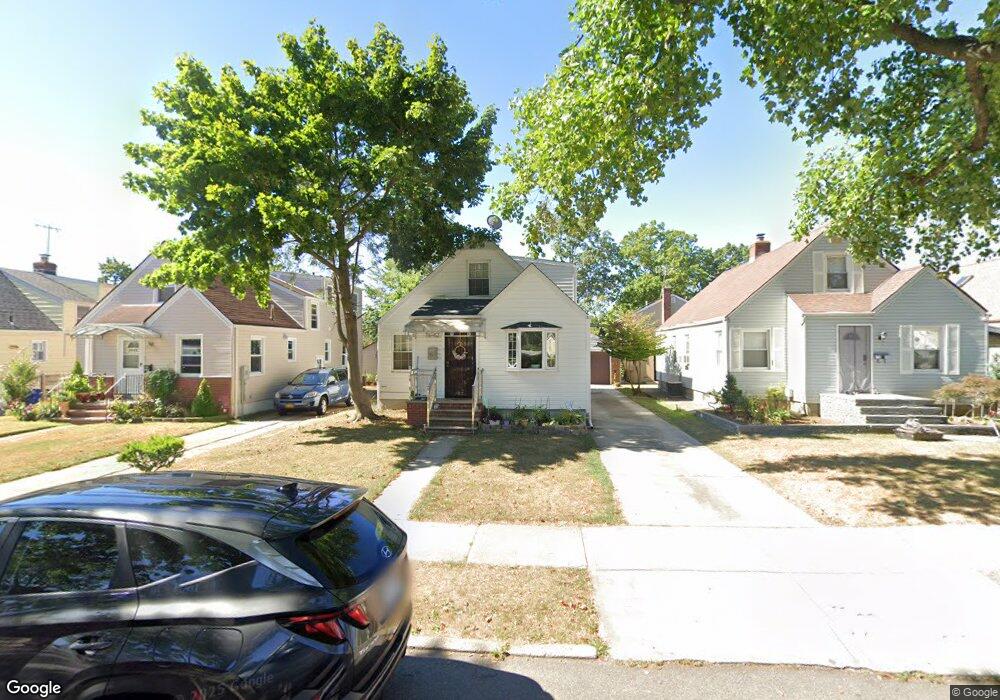
7642 266th St New Hyde Park, NY 11040
Glen Oaks NeighborhoodEstimated Value: $782,000 - $1,043,000
--
Bed
--
Bath
1,564
Sq Ft
$589/Sq Ft
Est. Value
About This Home
This home is located at 7642 266th St, New Hyde Park, NY 11040 and is currently estimated at $920,724, approximately $588 per square foot. 7642 266th St is a home located in Queens County with nearby schools including P.S.115Q James J Ambrose School, Fremont/Hay Elementary School, and Irwin Altman Middle School 172.
Ownership History
Date
Name
Owned For
Owner Type
Purchase Details
Closed on
Oct 19, 2016
Sold by
Mukherjee Tripti
Bought by
Shi Chong and Yin Xiaojing
Current Estimated Value
Home Financials for this Owner
Home Financials are based on the most recent Mortgage that was taken out on this home.
Original Mortgage
$200,000
Outstanding Balance
$159,577
Interest Rate
3.48%
Mortgage Type
New Conventional
Estimated Equity
$761,147
Purchase Details
Closed on
Jun 6, 2002
Sold by
Chandler Santosh
Bought by
Mukherjee Tripti
Home Financials for this Owner
Home Financials are based on the most recent Mortgage that was taken out on this home.
Original Mortgage
$36,500
Interest Rate
6.64%
Mortgage Type
Purchase Money Mortgage
Purchase Details
Closed on
Jun 11, 1999
Sold by
Chander Harish and Chander Santosh
Bought by
Chander Santosh
Purchase Details
Closed on
Oct 27, 1988
Sold by
Padnick Eva
Bought by
Chander Harish and Chander Santosh
Create a Home Valuation Report for This Property
The Home Valuation Report is an in-depth analysis detailing your home's value as well as a comparison with similar homes in the area
Home Values in the Area
Average Home Value in this Area
Purchase History
| Date | Buyer | Sale Price | Title Company |
|---|---|---|---|
| Shi Chong | $600,000 | -- | |
| Shi Chong | $600,000 | -- | |
| Shi Chong | $600,000 | -- | |
| Mukherjee Tripti | -- | -- | |
| Mukherjee Tripti | -- | -- | |
| Chander Santosh | -- | -- | |
| Chander Santosh | -- | -- | |
| Chander Harish | -- | -- | |
| Chander Harish | -- | -- |
Source: Public Records
Mortgage History
| Date | Status | Borrower | Loan Amount |
|---|---|---|---|
| Open | Shi Chong | $200,000 | |
| Closed | Shi Chong | $200,000 | |
| Previous Owner | Mukherjee Tripti | $36,500 |
Source: Public Records
Tax History Compared to Growth
Tax History
| Year | Tax Paid | Tax Assessment Tax Assessment Total Assessment is a certain percentage of the fair market value that is determined by local assessors to be the total taxable value of land and additions on the property. | Land | Improvement |
|---|---|---|---|---|
| 2025 | $9,515 | $47,796 | $14,618 | $33,178 |
| 2024 | $9,515 | $47,376 | $14,445 | $32,931 |
| 2023 | $8,996 | $44,789 | $13,785 | $31,004 |
| 2022 | $8,840 | $47,580 | $17,580 | $30,000 |
| 2021 | $8,879 | $49,260 | $17,580 | $31,680 |
| 2020 | $8,431 | $42,360 | $17,580 | $24,780 |
| 2019 | $8,259 | $46,680 | $17,580 | $29,100 |
| 2018 | $7,608 | $37,324 | $17,442 | $19,882 |
| 2017 | $7,522 | $36,900 | $17,580 | $19,320 |
| 2016 | $7,029 | $36,900 | $17,580 | $19,320 |
| 2015 | $4,243 | $33,192 | $18,761 | $14,431 |
| 2014 | $4,243 | $32,900 | $17,821 | $15,079 |
Source: Public Records
Map
Nearby Homes
- 78-07 264th St
- 7653 268th St
- 78-37 267th St
- 7611 270th St
- 260-73 75th Ave Unit 1st Fl
- 260-18 75th Ave Unit 1st fl
- 79-12 268th St
- 78-30 270th St
- 263-55 74th Ave Unit A-2
- 7836 271st St
- 78-36 271st St
- 73-20 263rd St Unit G
- 264-65 Langston Ave Unit GV133E10-2
- 74-12 260th St Unit H-2
- 264-17 Langston Ave Unit 2nd fl
- 80-18 261st St
- 264-15 Langston Ave Unit 1st FL
- 264-37 Langston Ave Unit A
- 80-64 266th St
- 264-11 73rd Ave Unit 128A4