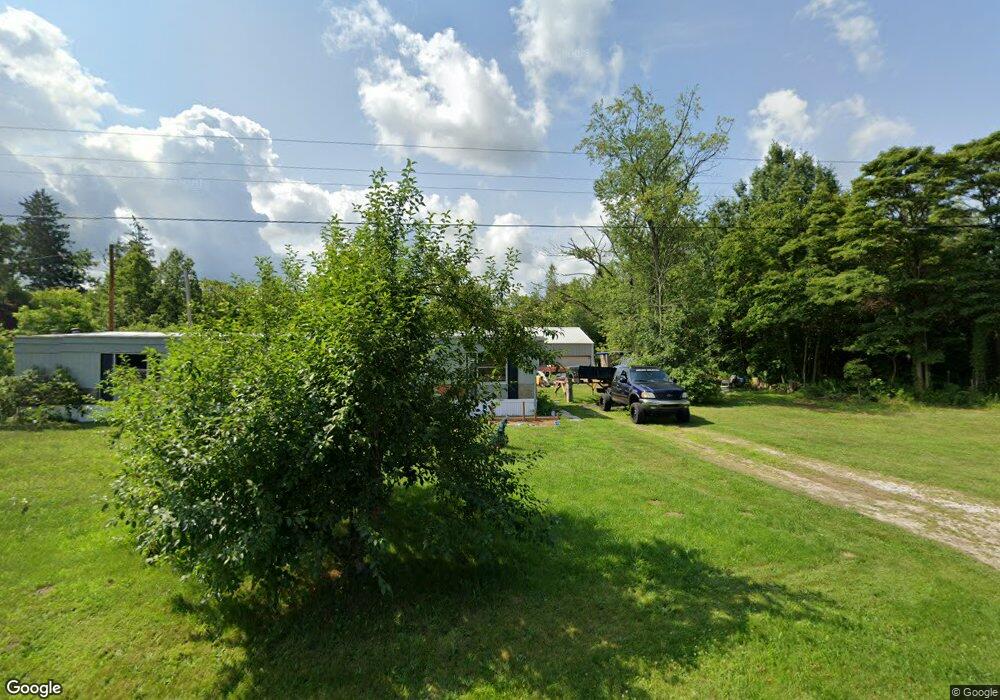
76423 38th Ave Covert, MI 49043
Estimated Value: $55,776 - $140,000
3
Beds
1
Bath
978
Sq Ft
$98/Sq Ft
Est. Value
About This Home
This home is located at 76423 38th Ave, Covert, MI 49043 and is currently estimated at $96,194, approximately $98 per square foot. 76423 38th Ave is a home located in Van Buren County with nearby schools including Covert Elementary School, Covert Middle School, and Covert High School.
Ownership History
Date
Name
Owned For
Owner Type
Purchase Details
Closed on
Sep 7, 2022
Sold by
Scott Brian Keith
Bought by
Payne Kristy Marie
Current Estimated Value
Purchase Details
Closed on
Jan 10, 2014
Sold by
Peterson Hope Andrea and Badfish Hope A
Bought by
Payne Kristy Marie
Purchase Details
Closed on
Nov 21, 2013
Sold by
Scott Jamy L
Bought by
Scott Brian K
Purchase Details
Closed on
Jun 3, 2006
Sold by
Sarno James F and Atsumi Edith
Bought by
Scott Brian Keith and Scott Jamy Lynn
Purchase Details
Closed on
Aug 1, 2005
Sold by
Scott Brian Keith and Scott Jamy Lynn
Bought by
Bodfish Hope Andria
Home Financials for this Owner
Home Financials are based on the most recent Mortgage that was taken out on this home.
Original Mortgage
$39,700
Interest Rate
6.71%
Mortgage Type
Seller Take Back
Purchase Details
Closed on
Oct 1, 1997
Sold by
Mullins Michael and Mullins Laura
Bought by
Sarno James F and Sarno Lois
Create a Home Valuation Report for This Property
The Home Valuation Report is an in-depth analysis detailing your home's value as well as a comparison with similar homes in the area
Purchase History
| Date | Buyer | Sale Price | Title Company |
|---|---|---|---|
| Payne Kristy Marie | $40,000 | -- | |
| Payne Kristy Marie | -- | None Available | |
| Scott Brian K | -- | None Available | |
| Scott Brian Keith | $20,500 | None Available | |
| Bodfish Hope Andria | $40,000 | None Available | |
| Sarno James F | -- | -- |
Source: Public Records
Mortgage History
| Date | Status | Borrower | Loan Amount |
|---|---|---|---|
| Previous Owner | Bodfish Hope Andria | $39,700 |
Source: Public Records
Tax History
| Year | Tax Paid | Tax Assessment Tax Assessment Total Assessment is a certain percentage of the fair market value that is determined by local assessors to be the total taxable value of land and additions on the property. | Land | Improvement |
|---|---|---|---|---|
| 2025 | $419 | $19,800 | $0 | $0 |
| 2024 | $178 | $19,700 | $0 | $0 |
| 2023 | $170 | $17,100 | $0 | $0 |
| 2022 | $389 | $15,100 | $0 | $0 |
| 2021 | $380 | $13,100 | $5,400 | $7,700 |
| 2020 | $398 | $13,100 | $5,400 | $7,700 |
| 2019 | $393 | $13,000 | $13,000 | $0 |
| 2018 | $398 | $13,700 | $13,700 | $0 |
| 2017 | $410 | $13,400 | $0 | $0 |
| 2016 | $394 | $13,400 | $0 | $0 |
| 2015 | $467 | $13,400 | $0 | $0 |
| 2014 | $500 | $17,400 | $0 | $0 |
| 2013 | -- | $16,500 | $16,500 | $0 |
Source: Public Records
Map
Nearby Homes
- 77544 38th Ave
- 35580 76th St
- VL 76th St
- 34637 76th St
- 39050 78th St
- 00 Cr 378
- 42439 78th St
- 47458 Highway M-140
- 46333 Highway M-140
- VL 32nd Ave
- 78720 County Road 376
- 74721 30th Ave
- 43278 Whispering Pines Path Unit 9
- 00 72nd St
- Vl 32nd Ave
- 29441 M 140 Hwy
- VL Ramblewood Dr
- VL 70th St
- 82078 North Ct
- 6609 Hollywood Dr
Your Personal Tour Guide
Ask me questions while you tour the home.