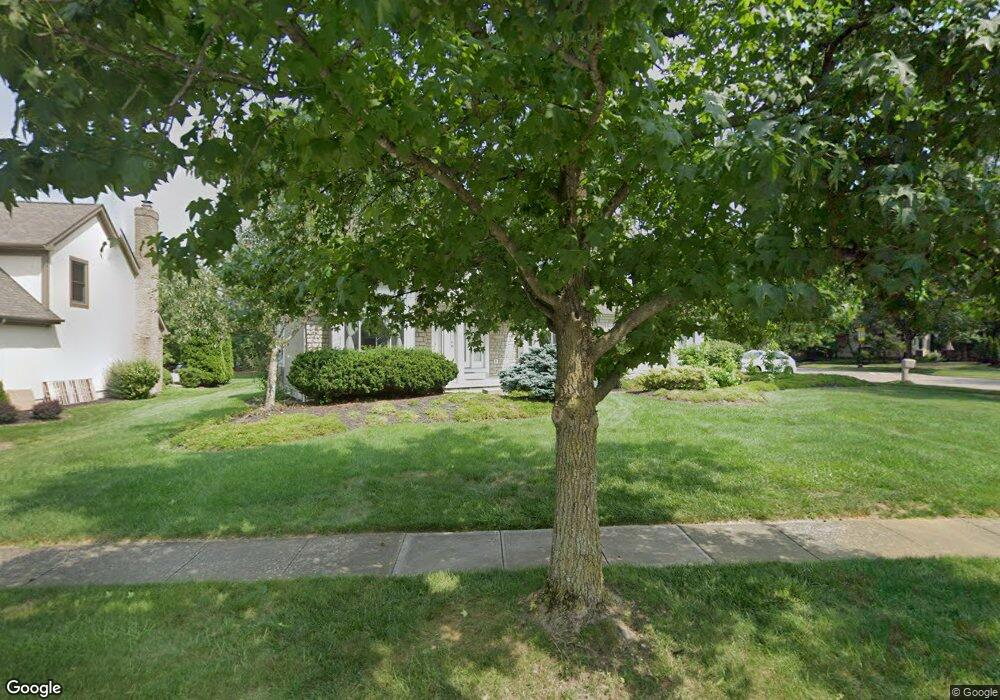
7646 Wallsend Ct Dublin, OH 43017
Estimated Value: $639,000 - $670,000
3
Beds
3
Baths
2,894
Sq Ft
$226/Sq Ft
Est. Value
About This Home
This home is located at 7646 Wallsend Ct, Dublin, OH 43017 and is currently estimated at $654,671, approximately $226 per square foot. 7646 Wallsend Ct is a home located in Franklin County with nearby schools including Mary Emma Bailey Elementary School, John Sells Middle School, and Dublin Coffman High School.
Ownership History
Date
Name
Owned For
Owner Type
Purchase Details
Closed on
May 31, 2024
Sold by
Yang Family Trust and Yang Preservation Trust
Bought by
Gehring Lisa F and Sullivan Stephen
Current Estimated Value
Home Financials for this Owner
Home Financials are based on the most recent Mortgage that was taken out on this home.
Original Mortgage
$487,500
Outstanding Balance
$481,362
Interest Rate
7.09%
Mortgage Type
New Conventional
Estimated Equity
$173,309
Purchase Details
Closed on
Apr 17, 2018
Sold by
Yang Jerry J and Yang Elaine
Bought by
Yang Jennifer and Yang Annie
Purchase Details
Closed on
Sep 7, 2001
Sold by
Kovac Roman and Kovac Michele L
Bought by
Yang Jerry J and Lee Elaine
Home Financials for this Owner
Home Financials are based on the most recent Mortgage that was taken out on this home.
Original Mortgage
$219,600
Interest Rate
6.12%
Mortgage Type
Purchase Money Mortgage
Purchase Details
Closed on
Jan 14, 1992
Create a Home Valuation Report for This Property
The Home Valuation Report is an in-depth analysis detailing your home's value as well as a comparison with similar homes in the area
Home Values in the Area
Average Home Value in this Area
Purchase History
| Date | Buyer | Sale Price | Title Company |
|---|---|---|---|
| Gehring Lisa F | $650,000 | Valley Title & Escrow | |
| Yang Jennifer | -- | None Available | |
| Yang Jerry J | $274,500 | Midland Celtic Title | |
| -- | $32,000 | -- |
Source: Public Records
Mortgage History
| Date | Status | Borrower | Loan Amount |
|---|---|---|---|
| Open | Gehring Lisa F | $487,500 | |
| Previous Owner | Yang Jerry J | $219,600 |
Source: Public Records
Tax History Compared to Growth
Tax History
| Year | Tax Paid | Tax Assessment Tax Assessment Total Assessment is a certain percentage of the fair market value that is determined by local assessors to be the total taxable value of land and additions on the property. | Land | Improvement |
|---|---|---|---|---|
| 2024 | $11,543 | $177,660 | $49,000 | $128,660 |
| 2023 | $11,382 | $177,660 | $49,000 | $128,660 |
| 2022 | $9,377 | $133,780 | $30,210 | $103,570 |
| 2021 | $9,400 | $133,780 | $30,210 | $103,570 |
| 2020 | $9,477 | $133,780 | $30,210 | $103,570 |
| 2019 | $9,406 | $117,430 | $26,250 | $91,180 |
| 2018 | $9,001 | $117,430 | $26,250 | $91,180 |
| 2017 | $8,754 | $117,430 | $26,250 | $91,180 |
| 2016 | $8,501 | $107,070 | $17,850 | $89,220 |
| 2015 | $8,556 | $107,070 | $17,850 | $89,220 |
| 2014 | $8,566 | $107,070 | $17,850 | $89,220 |
| 2013 | $4,152 | $101,990 | $17,010 | $84,980 |
Source: Public Records
Map
Nearby Homes
- 7668 Brandbury Place
- 5072 Galway Dr
- 4988 Galway Dr
- 4849 MacAllan Ct W
- 7325 Penneyroyal Place
- 5739 Rushwood Dr
- 0 Dublin Rd Unit 225039162
- 8025 Inistork Dr
- 4650 Chatham Ct
- 4640 Donegal Cliffs Dr
- 7575 Riverside Dr
- 4340 Manor Ct E
- 7121 Timberview Dr
- 6850 Mcdougal Ct
- 6848 Mcdevitt Ct
- 7744 Heatherwood Ln
- 5309 Adventure Dr
- 7035 Coffman Rd
- 0 Arrowhead Rd
- 5327 Brennan Ct
- 7654 Wallsend Ct
- 7616 Coventry Woods Dr
- 7662 Wallsend Ct
- 7651 Wallsend Ct
- 7613 Gylwyn Ct
- 7659 Wallsend Ct
- 7619 Coventry Woods Dr
- 7608 Coventry Woods Dr
- 7608 Coventry Woods Dr N
- 7670 Wallsend Ct
- 7667 Wallsend Ct
- 7605 Gylwyn Ct
- 7600 Coventry Woods Dr
- 7611 Coventry Woods Dr
- 7664 Earlston Ct
- 7600 Coventry Woods Dr N
- 7678 Wallsend Ct
- 7614 Gylwyn Ct
- 7672 Earlston Ct
- 7603 Coventry Woods Dr