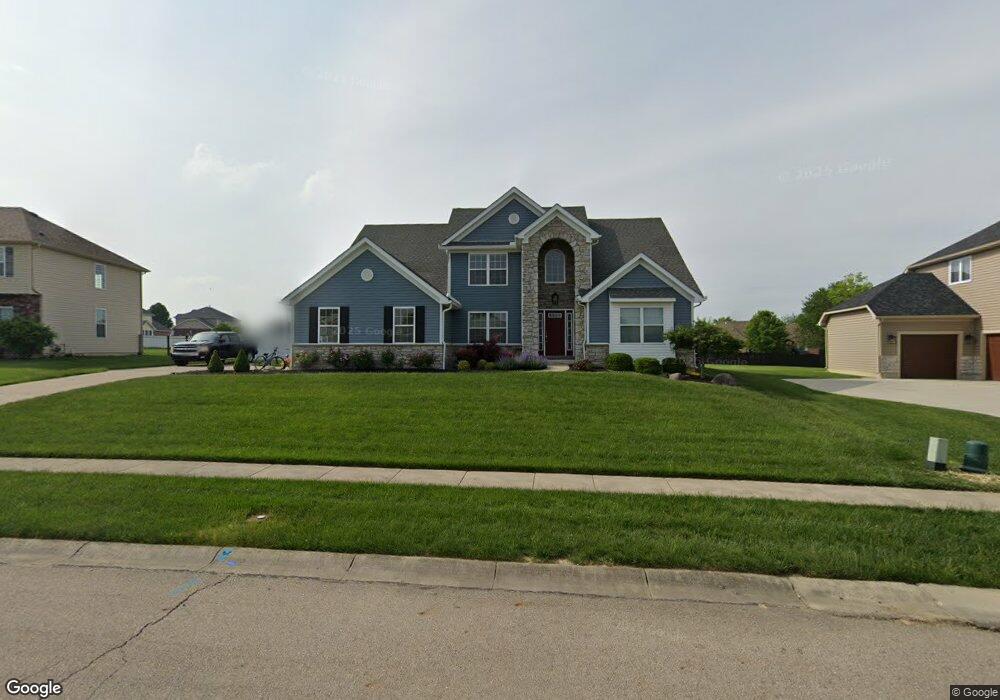
7649 Devonwood Dr Dayton, OH 45424
Estimated Value: $432,000 - $579,000
4
Beds
3
Baths
2,602
Sq Ft
$197/Sq Ft
Est. Value
About This Home
This home is located at 7649 Devonwood Dr, Dayton, OH 45424 and is currently estimated at $513,293, approximately $197 per square foot. 7649 Devonwood Dr is a home located in Montgomery County with nearby schools including Wayne High School and Huber Heights Christian Academy.
Ownership History
Date
Name
Owned For
Owner Type
Purchase Details
Closed on
Mar 26, 2019
Sold by
Dresel Kevin M and Kessler Andrew J
Bought by
Johnson Terranika D
Current Estimated Value
Home Financials for this Owner
Home Financials are based on the most recent Mortgage that was taken out on this home.
Original Mortgage
$351,116
Outstanding Balance
$308,693
Interest Rate
4.3%
Mortgage Type
VA
Estimated Equity
$204,600
Purchase Details
Closed on
Jun 27, 2007
Sold by
Generations Construction Co Llc
Bought by
Dresel Kevin M and Kessler Andrew J
Home Financials for this Owner
Home Financials are based on the most recent Mortgage that was taken out on this home.
Original Mortgage
$29,805
Interest Rate
6.42%
Mortgage Type
Stand Alone Second
Purchase Details
Closed on
Dec 18, 2006
Sold by
Generations Development Inc
Bought by
Generations Construction Co Llc
Create a Home Valuation Report for This Property
The Home Valuation Report is an in-depth analysis detailing your home's value as well as a comparison with similar homes in the area
Home Values in the Area
Average Home Value in this Area
Purchase History
| Date | Buyer | Sale Price | Title Company |
|---|---|---|---|
| Johnson Terranika D | $339,900 | Performance Title Inc | |
| Dresel Kevin M | $298,100 | Midwest Title Company | |
| Generations Construction Co Llc | -- | None Available |
Source: Public Records
Mortgage History
| Date | Status | Borrower | Loan Amount |
|---|---|---|---|
| Open | Johnson Terranika D | $351,116 | |
| Previous Owner | Dresel Kevin M | $29,805 | |
| Previous Owner | Dresel Kevin M | $238,440 |
Source: Public Records
Tax History Compared to Growth
Tax History
| Year | Tax Paid | Tax Assessment Tax Assessment Total Assessment is a certain percentage of the fair market value that is determined by local assessors to be the total taxable value of land and additions on the property. | Land | Improvement |
|---|---|---|---|---|
| 2024 | $7,995 | $157,480 | $20,320 | $137,160 |
| 2023 | $7,995 | $157,480 | $20,320 | $137,160 |
| 2022 | $7,932 | $122,080 | $15,750 | $106,330 |
| 2021 | $7,959 | $122,080 | $15,750 | $106,330 |
| 2020 | $7,966 | $122,080 | $15,750 | $106,330 |
| 2019 | $5,715 | $77,400 | $15,750 | $61,650 |
| 2018 | $5,735 | $77,400 | $15,750 | $61,650 |
| 2017 | $5,299 | $77,400 | $15,750 | $61,650 |
| 2016 | $5,299 | $70,460 | $15,750 | $54,710 |
| 2015 | $5,230 | $70,460 | $15,750 | $54,710 |
| 2014 | $5,230 | $70,460 | $15,750 | $54,710 |
| 2012 | -- | $73,710 | $17,500 | $56,210 |
Source: Public Records
Map
Nearby Homes
- 7821 Wedgemere Cir
- 7750 Beldale Ave
- 7256 Windsor Ridge Dr
- 6579 Mikusa Ln
- 7247 Bostelman Place
- 7515 Beldale Ave
- 6795 Fishburg Rd
- 6739 Evergreen Woods Dr
- 7222 Brandtvista Ave
- 7236 Charlesworth Dr
- 7643 Walmac St
- 7424 Chatlake Dr
- 6561 Fishburg Rd
- 6506 Tellea St
- 7061 Rio Vista Ct
- 4239 Silver Oak Way
- 4893 Bath Rd
- 6960 Serene Place
- 6917 Buell Ln
- 7011 Safari Dr
- 7649 Devonwood Ct
- 7639 Devonwood Ct
- 7661 Devonwood Ct
- 7661 Devonwood Dr
- 7625 Devonwood Ct
- 7673 Devonwood Ct
- 7551 Callamere Farms Dr
- 7656 Devonwood Ct
- 6956 Breckenwood Dr
- 7646 Devonwood Dr Unit 91
- 7646 Devonwood Dr
- 7668 Devonwood Dr Unit 93
- 7668 Devonwood Dr
- 7685 Devonwood Ct
- 7632 Callamere Farms Dr
- 6946 Breckenwood Dr
- 6970 Breckenwood Dr
- 6936 Breckenwood Dr
- 7680 Devonwood Ct
- 7531 Callamere Farms Dr