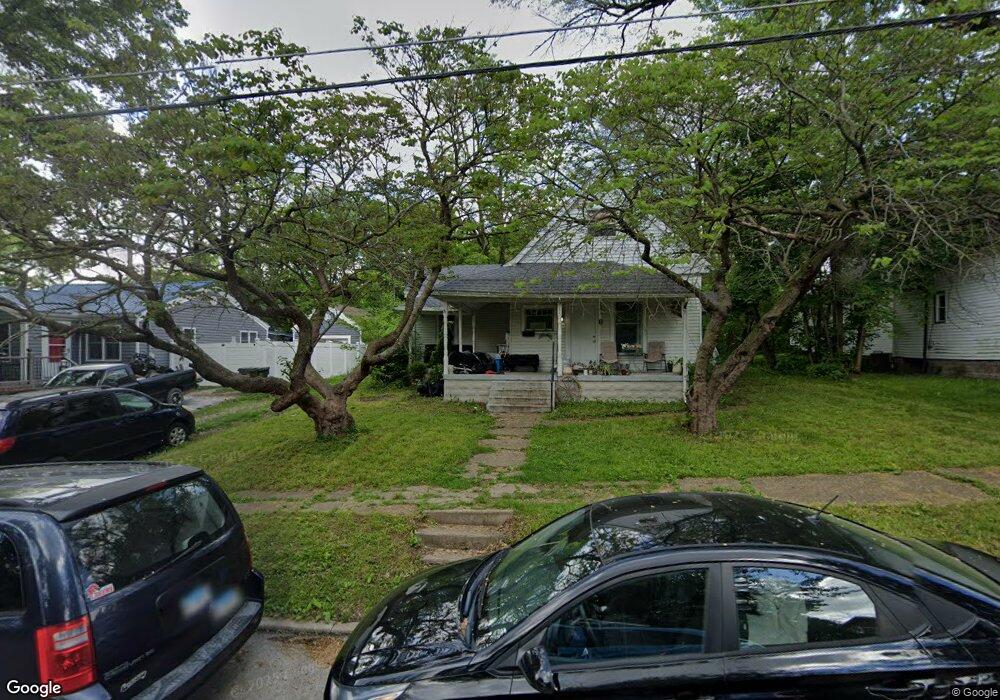
765 11th St Charleston, IL 61920
Estimated Value: $68,161 - $86,000
3
Beds
1
Bath
1,022
Sq Ft
$78/Sq Ft
Est. Value
About This Home
This home is located at 765 11th St, Charleston, IL 61920 and is currently estimated at $79,290, approximately $77 per square foot. 765 11th St is a home located in Coles County with nearby schools including Charleston High School and Charleston Christian Academy.
Ownership History
Date
Name
Owned For
Owner Type
Purchase Details
Closed on
Oct 5, 2018
Sold by
Dixon Tyler W
Bought by
Dixon Tyler W and Renfro John
Current Estimated Value
Purchase Details
Closed on
Sep 27, 2018
Sold by
Tami L Wells
Bought by
Dixon Tyler W
Purchase Details
Closed on
May 16, 2013
Sold by
Krabbenhoft Gregory S and Krabbenhoft Sherry A
Bought by
Zendeli Shklqim and Zendeli Faik
Purchase Details
Closed on
Dec 2, 2010
Sold by
Gross Mildred B
Bought by
United States Department Of Agriculture
Purchase Details
Closed on
Apr 30, 2008
Sold by
Giberson Gina
Bought by
Edwards Jackie Lynn
Purchase Details
Closed on
Sep 18, 2006
Sold by
Manley Everett A and Manley Leona B
Bought by
Manley Everett A and Manley Leona B
Purchase Details
Closed on
Mar 10, 2006
Sold by
Eagan James E
Bought by
City Of Charleston
Purchase Details
Closed on
Jan 27, 2006
Sold by
Ogden Kenneth M and Ogden Beverly A
Bought by
Giberson Gina
Create a Home Valuation Report for This Property
The Home Valuation Report is an in-depth analysis detailing your home's value as well as a comparison with similar homes in the area
Home Values in the Area
Average Home Value in this Area
Purchase History
| Date | Buyer | Sale Price | Title Company |
|---|---|---|---|
| Dixon Tyler W | -- | None Available | |
| Dixon Tyler W | $18,000 | None Available | |
| Zendeli Shklqim | $20,000 | None Available | |
| United States Department Of Agriculture | $17,500 | None Available | |
| Edwards Jackie Lynn | -- | None Available | |
| Manley Everett A | -- | None Available | |
| City Of Charleston | -- | None Available | |
| Giberson Gina | -- | None Available |
Source: Public Records
Tax History Compared to Growth
Tax History
| Year | Tax Paid | Tax Assessment Tax Assessment Total Assessment is a certain percentage of the fair market value that is determined by local assessors to be the total taxable value of land and additions on the property. | Land | Improvement |
|---|---|---|---|---|
| 2024 | $900 | $11,602 | $3,096 | $8,506 |
| 2023 | $887 | $10,595 | $2,827 | $7,768 |
| 2022 | $888 | $10,420 | $2,780 | $7,640 |
| 2021 | $915 | $10,000 | $2,668 | $7,332 |
| 2020 | $931 | $10,361 | $4,929 | $5,432 |
| 2019 | $916 | $10,000 | $4,757 | $5,243 |
| 2018 | $906 | $10,000 | $4,757 | $5,243 |
| 2017 | $894 | $10,000 | $4,757 | $5,243 |
| 2016 | $494 | $10,000 | $4,757 | $5,243 |
| 2015 | $1,117 | $10,000 | $4,757 | $5,243 |
| 2014 | $1,117 | $10,000 | $4,757 | $5,243 |
| 2013 | $1,117 | $10,000 | $4,757 | $5,243 |
Source: Public Records
Map
Nearby Homes
- 9 Brosam Dr
- 1520 Harrison Ave
- 6 Brosam Dr
- 1524 Adams Ave
- 1011 6th St
- 1103 & 1105 6th St
- 409 3rd St
- 1125 6th St
- 943 2nd St
- 29 Miller Ave
- 124 Polk Ave
- 308 N 7th St
- 926 Division St
- Lot 28 Tanglewood Dr
- Lot 35 Tanglewood Dr
- Lot 55 Tippecanoe Ave
- 1016 Hawthorne Dr
- Lot 41 Hawthorne Dr
- Lot 43 Hawthorne Dr
- Lot 45 Hawthorne Dr