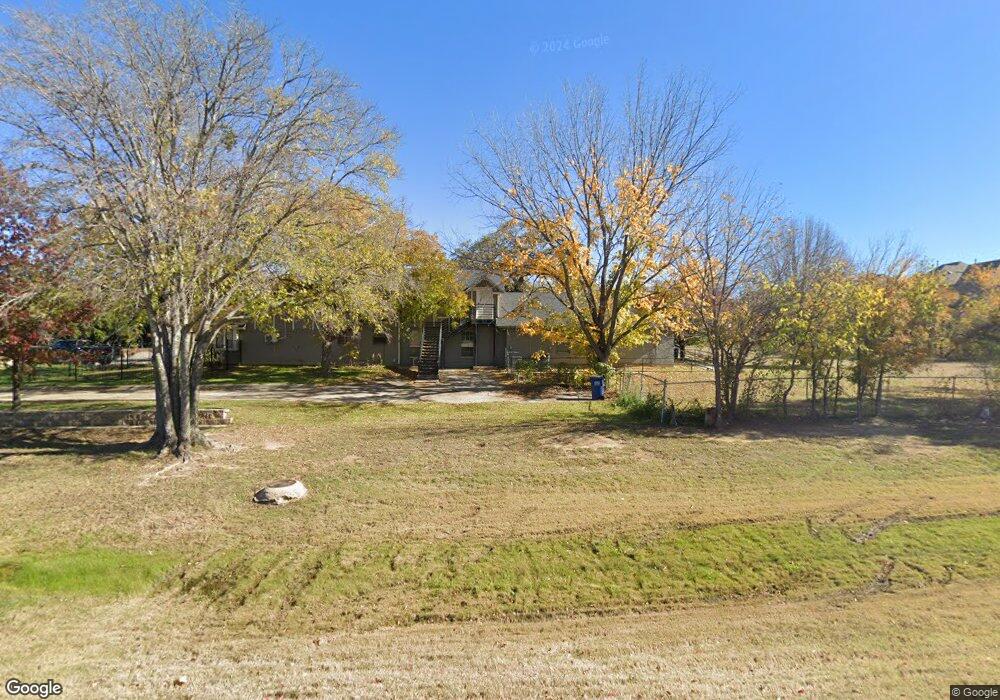
765 Bandit Trail Keller, TX 76248
Hidden Lakes NeighborhoodEstimated Value: $920,000 - $1,280,000
7
Beds
4
Baths
4,558
Sq Ft
$239/Sq Ft
Est. Value
About This Home
This home is located at 765 Bandit Trail, Keller, TX 76248 and is currently estimated at $1,087,243, approximately $238 per square foot. 765 Bandit Trail is a home located in Tarrant County with nearby schools including Liberty Elementary School, Bear Creek Intermediate School, and Keller Middle School.
Ownership History
Date
Name
Owned For
Owner Type
Purchase Details
Closed on
Jan 12, 2021
Sold by
Pharmasol Inc
Bought by
Jiang Xuwei
Current Estimated Value
Purchase Details
Closed on
Aug 29, 2014
Sold by
Nelson Frances A and Allen Billy Dean
Bought by
Pharmasol Inc
Home Financials for this Owner
Home Financials are based on the most recent Mortgage that was taken out on this home.
Original Mortgage
$360,000
Interest Rate
4.15%
Mortgage Type
Purchase Money Mortgage
Purchase Details
Closed on
Apr 8, 1996
Sold by
Young Thomas Willard and Young Thomas Willard
Bought by
Borden Family Trust
Purchase Details
Closed on
Aug 15, 1995
Sold by
Thomas Willard Young and Thomas Cinda L
Bought by
Nelson Donald J and Nelson Frances A
Home Financials for this Owner
Home Financials are based on the most recent Mortgage that was taken out on this home.
Original Mortgage
$155,250
Interest Rate
7.59%
Create a Home Valuation Report for This Property
The Home Valuation Report is an in-depth analysis detailing your home's value as well as a comparison with similar homes in the area
Home Values in the Area
Average Home Value in this Area
Purchase History
| Date | Buyer | Sale Price | Title Company |
|---|---|---|---|
| Jiang Xuwei | -- | None Listed On Document | |
| Pharmasol Inc | -- | Rtc | |
| Borden Family Trust | -- | Rattikin Title Co | |
| Nelson Donald J | -- | Commonwealth Land Title |
Source: Public Records
Mortgage History
| Date | Status | Borrower | Loan Amount |
|---|---|---|---|
| Previous Owner | Pharmasol Inc | $360,000 | |
| Previous Owner | Nelson Donald J | $155,250 |
Source: Public Records
Tax History Compared to Growth
Tax History
| Year | Tax Paid | Tax Assessment Tax Assessment Total Assessment is a certain percentage of the fair market value that is determined by local assessors to be the total taxable value of land and additions on the property. | Land | Improvement |
|---|---|---|---|---|
| 2025 | $7,265 | $624,488 | $386,500 | $237,988 |
| 2024 | $7,265 | $721,952 | $386,500 | $335,452 |
| 2023 | $8,363 | $1,064,504 | $386,500 | $678,004 |
| 2022 | $15,442 | $700,000 | $386,500 | $313,500 |
| 2021 | $9,513 | $400,000 | $307,098 | $92,902 |
| 2020 | $25,066 | $1,045,830 | $307,098 | $738,732 |
| 2019 | $26,331 | $1,045,830 | $307,098 | $738,732 |
| 2018 | $25,830 | $1,025,923 | $307,098 | $718,825 |
| 2017 | $26,370 | $1,023,419 | $307,098 | $716,321 |
| 2016 | $16,831 | $653,215 | $360,000 | $293,215 |
| 2015 | $9,327 | $356,200 | $84,600 | $271,600 |
| 2014 | $9,327 | $356,200 | $84,600 | $271,600 |
Source: Public Records
Map
Nearby Homes
- 1112 Rhett Dr
- 8713 Davis Blvd
- 7033 Benjamin
- 2822 Volterra Way
- 1013 Pienza Path
- 2800 Lake Shore Dr
- 9005 Trails Edge Dr
- 6912 Handel
- 6809 Strauss
- 801 Glenmont Rd
- 912 Chateau Ct
- 1010 W Mcdonwell School Rd
- 3325 Creek Rd
- 512 Bandit Trail
- 510 Bandit Trail
- 805 Pond Springs Ct
- 715 Misty Ct
- 606 Eagle Ct
- 6776 St Moritz Pkwy
- 2409 Southern Hills Ct
- 761 Bandit Trail
- 759 Bandit Trail
- 1124 Guthrie Ct
- 1120 Guthrie Ct
- 1116 Guthrie Ct
- 1112 Guthrie Ct
- 764 Bandit Trail
- 1108 Guthrie Ct
- 757 Bandit Trail
- 768 Bandit Trail
- 760 Bandit Trail
- 1104 Guthrie Ct
- 1117 Guthrie Ct
- 1113 Guthrie Ct
- 756 Bandit Trail
- 755 Bandit Trail
- 1109 Guthrie Ct
- 1100 Guthrie Ct
- 1105 Guthrie Ct
- 1116 Rhett Dr