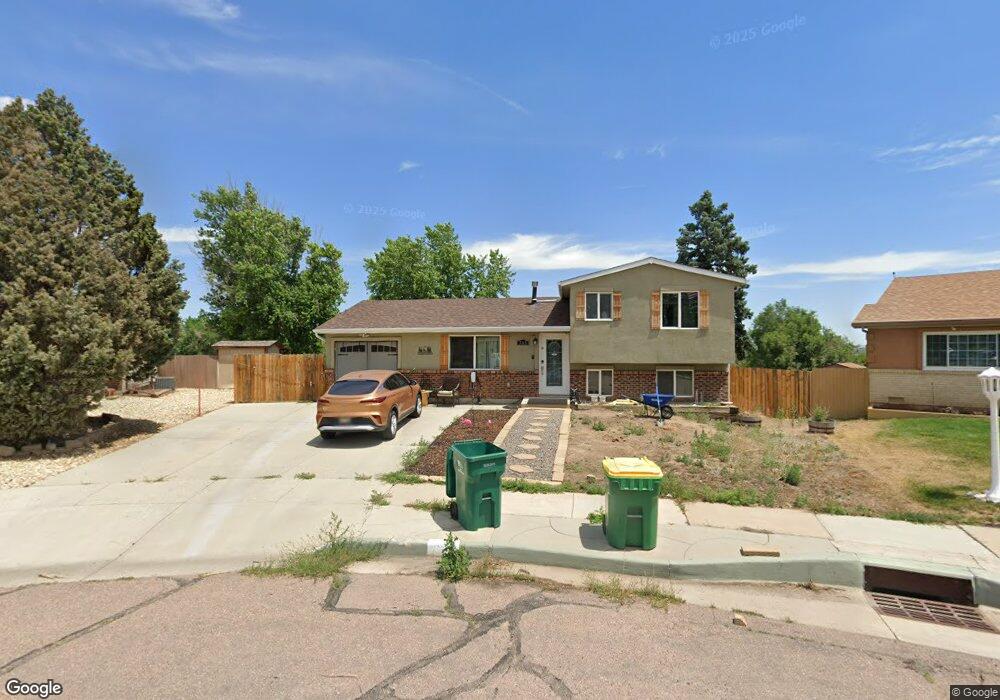
765 Calle Entrada Fountain, CO 80817
North Fountain Valley NeighborhoodEstimated Value: $343,000 - $373,000
3
Beds
2
Baths
861
Sq Ft
$413/Sq Ft
Est. Value
About This Home
This home is located at 765 Calle Entrada, Fountain, CO 80817 and is currently estimated at $355,600, approximately $413 per square foot. 765 Calle Entrada is a home located in El Paso County with nearby schools including Mesa Elementary School, Fountain Middle School, and Fountain-Fort Carson High School.
Ownership History
Date
Name
Owned For
Owner Type
Purchase Details
Closed on
Dec 7, 2021
Sold by
Farley Darlk
Bought by
Ortiz Justin S and Ortiz Chloe E
Current Estimated Value
Home Financials for this Owner
Home Financials are based on the most recent Mortgage that was taken out on this home.
Original Mortgage
$381,579
Outstanding Balance
$351,000
Interest Rate
3.12%
Mortgage Type
VA
Estimated Equity
$4,600
Purchase Details
Closed on
Mar 8, 2013
Sold by
Solano James J and Yates Brenda L
Bought by
Farley Derik
Home Financials for this Owner
Home Financials are based on the most recent Mortgage that was taken out on this home.
Original Mortgage
$135,850
Interest Rate
3.44%
Mortgage Type
VA
Purchase Details
Closed on
Oct 10, 2008
Sold by
Easdon Kelly Donald and Easdon Kimberly Dawn
Bought by
Solano James J
Home Financials for this Owner
Home Financials are based on the most recent Mortgage that was taken out on this home.
Original Mortgage
$117,000
Interest Rate
6.46%
Mortgage Type
Unknown
Purchase Details
Closed on
Apr 30, 2007
Sold by
Green Tree Servicing Llc
Bought by
Easdon Kelly Donald and Easdon Kimberly Dawn
Home Financials for this Owner
Home Financials are based on the most recent Mortgage that was taken out on this home.
Original Mortgage
$115,000
Interest Rate
6.13%
Mortgage Type
Unknown
Purchase Details
Closed on
Jul 7, 2006
Sold by
Root Richard L and Root Mollymarie
Bought by
Emerging Properties Inc
Purchase Details
Closed on
Dec 29, 1994
Sold by
Pitcairn David L
Bought by
Root Richard L and Root Mollymarie
Home Financials for this Owner
Home Financials are based on the most recent Mortgage that was taken out on this home.
Original Mortgage
$71,298
Interest Rate
8.25%
Mortgage Type
VA
Purchase Details
Closed on
Apr 30, 1991
Bought by
Farley Derik
Purchase Details
Closed on
Dec 12, 1990
Bought by
Farley Derik
Purchase Details
Closed on
Oct 19, 1989
Bought by
Farley Derik
Purchase Details
Closed on
May 11, 1989
Bought by
Farley Derik
Purchase Details
Closed on
Dec 27, 1978
Bought by
Farley Derik
Purchase Details
Closed on
Nov 18, 1974
Bought by
Farley Derik
Purchase Details
Closed on
Jul 30, 1973
Bought by
Farley Derik
Purchase Details
Closed on
Apr 5, 1973
Bought by
Farley Derik
Purchase Details
Closed on
Mar 9, 1973
Bought by
Farley Derik
Purchase Details
Closed on
Dec 7, 1972
Bought by
Farley Derik
Create a Home Valuation Report for This Property
The Home Valuation Report is an in-depth analysis detailing your home's value as well as a comparison with similar homes in the area
Home Values in the Area
Average Home Value in this Area
Purchase History
| Date | Buyer | Sale Price | Title Company |
|---|---|---|---|
| Ortiz Justin S | $373,000 | Empire Title Co Springs Llc | |
| Ortiz Justin S | $373,000 | Empire Title Co Springs Llc | |
| Farley Derik | -- | Heritage Title | |
| Farley Derik S | $133,000 | Heritage Title | |
| Solano James J | $147,000 | Security Title | |
| Easdon Kelly Donald | $115,000 | Stewart Title Of Colorado | |
| Emerging Properties Inc | -- | None Available | |
| Root Richard L | $70,000 | -- | |
| Farley Derik | -- | -- | |
| Farley Derik | -- | -- | |
| Farley Derik | $51,000 | -- | |
| Farley Derik | -- | -- | |
| Farley Derik | -- | -- | |
| Farley Derik | -- | -- | |
| Farley Derik | -- | -- | |
| Farley Derik | -- | -- | |
| Farley Derik | -- | -- | |
| Farley Derik | -- | -- |
Source: Public Records
Mortgage History
| Date | Status | Borrower | Loan Amount |
|---|---|---|---|
| Open | Ortiz Justin S | $381,579 | |
| Closed | Ortiz Justin S | $381,579 | |
| Previous Owner | Farley Derik S | $135,850 | |
| Previous Owner | Solano James J | $117,000 | |
| Previous Owner | Easdon Kelly Donald | $115,000 | |
| Previous Owner | Root Richard L | $71,298 |
Source: Public Records
Tax History Compared to Growth
Tax History
| Year | Tax Paid | Tax Assessment Tax Assessment Total Assessment is a certain percentage of the fair market value that is determined by local assessors to be the total taxable value of land and additions on the property. | Land | Improvement |
|---|---|---|---|---|
| 2025 | $1,199 | $23,090 | -- | -- |
| 2024 | $1,053 | $23,680 | $3,620 | $20,060 |
| 2022 | $933 | $15,990 | $2,860 | $13,130 |
| 2021 | $867 | $16,460 | $2,950 | $13,510 |
| 2020 | $661 | $12,280 | $2,570 | $9,710 |
| 2019 | $648 | $12,280 | $2,570 | $9,710 |
| 2018 | $546 | $9,980 | $2,590 | $7,390 |
| 2017 | $539 | $9,980 | $2,590 | $7,390 |
| 2016 | $562 | $10,400 | $2,690 | $7,710 |
| 2015 | $563 | $10,400 | $2,690 | $7,710 |
| 2014 | $588 | $10,920 | $2,690 | $8,230 |
Source: Public Records
Map
Nearby Homes
- 803 Ridgebury Place
- 7166 Araia Dr
- 7069 Reunion Cir
- 7015 Reunion Cir
- 1355 Fountain Mesa Rd
- 570 Calle Entrada
- 7081 Ancestra Dr
- 830 Winebrook Way
- 510 Avenida Del Cielo
- 654 High Tea Ct
- 2031 Hibbard Ln
- 6969 Ancestra Dr
- 739 Memory Ln
- 7327 Willow Pines Place
- 960 Lords Hill Dr
- 440 Calle Entrada
- 1034 Fountain Mesa Rd
- 7326 Legacy Point
- 9223 Waters Edge Dr
- 7431 Willow Pines Place
- 775 Calle Entrada
- 755 Calle Entrada
- 780 Calle Entrada
- 745 Calle Entrada
- 735 Calle Entrada
- 770 Calle Entrada
- 760 Calle Entrada
- 750 Calle Entrada
- 725 Calle Entrada
- 811 Ridgebury Place
- 819 Ridgebury Place
- 740 Calle Entrada
- 7254 Araia Dr
- 827 Ridgebury Place
- 7246 Araia Dr
- 7262 Araia Dr
- 7238 Araia Dr
- 715 Calle Entrada
- 730 Calle Entrada
- 779 Ridgebury Place