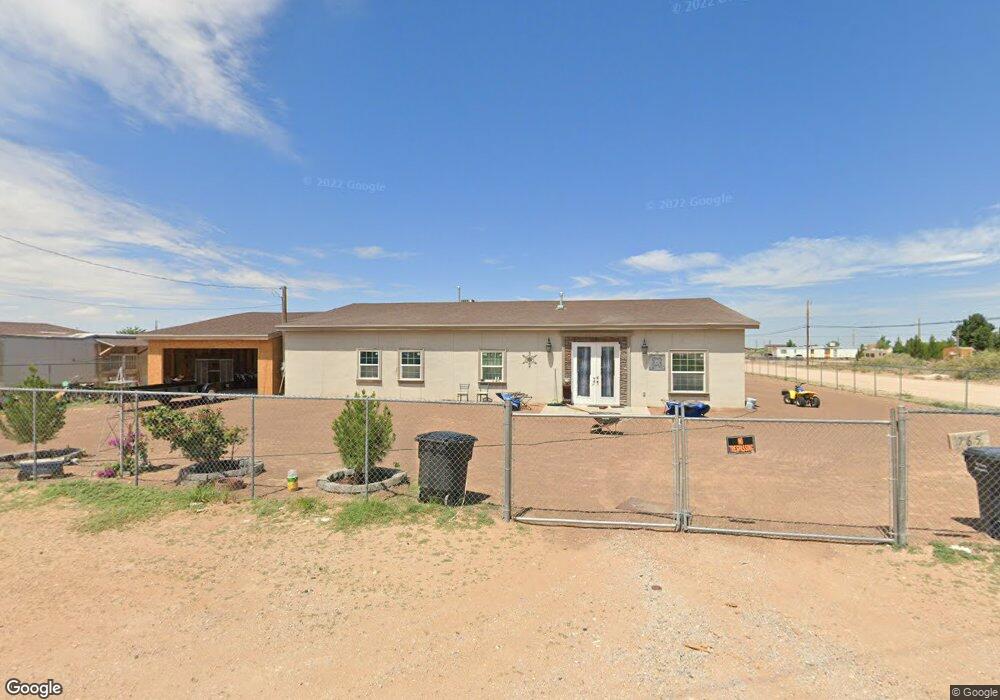
765 Jones Point Place El Paso, TX 79928
Estimated Value: $96,183 - $154,000
3
Beds
2
Baths
2,470
Sq Ft
$50/Sq Ft
Est. Value
About This Home
This home is located at 765 Jones Point Place, El Paso, TX 79928 and is currently estimated at $124,394, approximately $50 per square foot. 765 Jones Point Place is a home with nearby schools including Carroll T. Welch Elementary School, Horizon Middle School, and Horizon High School.
Ownership History
Date
Name
Owned For
Owner Type
Purchase Details
Closed on
Mar 19, 2025
Sold by
Benavides Angel De Jesus and Benavides Angel
Bought by
Padilla Isha Monic
Current Estimated Value
Purchase Details
Closed on
Nov 30, 2021
Sold by
Eickenloff Investments Llc
Bought by
Benavidez Angel De Jesus
Purchase Details
Closed on
Aug 4, 2015
Sold by
Secret Valley Joint Venture
Bought by
Benavidez Angel and Padilla Isha
Home Financials for this Owner
Home Financials are based on the most recent Mortgage that was taken out on this home.
Original Mortgage
$43,500
Interest Rate
12%
Mortgage Type
Commercial
Purchase Details
Closed on
Jul 7, 2015
Sold by
Hinojosa Patricia
Bought by
Secret Valley Joint Venture
Home Financials for this Owner
Home Financials are based on the most recent Mortgage that was taken out on this home.
Original Mortgage
$43,500
Interest Rate
12%
Mortgage Type
Commercial
Create a Home Valuation Report for This Property
The Home Valuation Report is an in-depth analysis detailing your home's value as well as a comparison with similar homes in the area
Home Values in the Area
Average Home Value in this Area
Purchase History
| Date | Buyer | Sale Price | Title Company |
|---|---|---|---|
| Padilla Isha Monic | -- | None Listed On Document | |
| Benavidez Angel De Jesus | -- | None Listed On Document | |
| Benavidez Angel | -- | None Available | |
| Secret Valley Joint Venture | $43,290 | None Available |
Source: Public Records
Mortgage History
| Date | Status | Borrower | Loan Amount |
|---|---|---|---|
| Previous Owner | Benavidez Angel | $43,500 |
Source: Public Records
Tax History Compared to Growth
Tax History
| Year | Tax Paid | Tax Assessment Tax Assessment Total Assessment is a certain percentage of the fair market value that is determined by local assessors to be the total taxable value of land and additions on the property. | Land | Improvement |
|---|---|---|---|---|
| 2025 | $955 | $405,894 | $39,473 | $366,421 |
| 2024 | $955 | $64,362 | $39,473 | $24,889 |
| 2023 | $955 | $63,186 | $0 | $0 |
| 2022 | $1,561 | $57,442 | $34,736 | $22,706 |
| 2021 | $1,576 | $56,484 | $33,947 | $22,537 |
| 2020 | $1,391 | $48,313 | $33,947 | $14,366 |
| 2018 | $1,384 | $48,313 | $33,947 | $14,366 |
| 2017 | $558 | $19,737 | $19,737 | $0 |
| 2016 | $558 | $19,737 | $19,737 | $0 |
| 2015 | -- | $19,737 | $19,737 | $0 |
Source: Public Records
Map
Nearby Homes
- 725 Ingham St Unit 90
- 724 Gasport St
- 0 Gasport St
- 15020 Kentwood Ave
- 1 Beach Blvd
- 27 Kentwood Ave
- 616 Agua Clara St
- 637 Agua Clara St
- TBD-1 Edmeston Ave
- TBD Depew Ave Ave
- TBD Enfield St
- 10 Kenwood
- 10 Acres Ascencion St
- TBD Alliger Ave
- TBD Alika
- TBD2 Grullen
- 850 Agua Fria Place
- 0 Scipto Ct
- 1 Scipto Ct
- TBD Horizon City Estates Lot #11
- 773 Jones Point Place
- 810 Ingham St
- 15081 Deferiet Ct
- 765 Lawton St
- 717 Ingham St
- 773 Lawton St
- 15070 Edmeston
- 817 Jones Point Place
- 701 Ingham St
- 741 Ingham St
- 14990 Carlton Ave
- 758 Lawton St
- 766 Lawton St
- 716 Harris St
- 774 Lawton St
- 774 Lawton St
- 14975 Edmeston Ave
- 700 Harris St
- 833 Jones Point Place
- 825 Lawton St