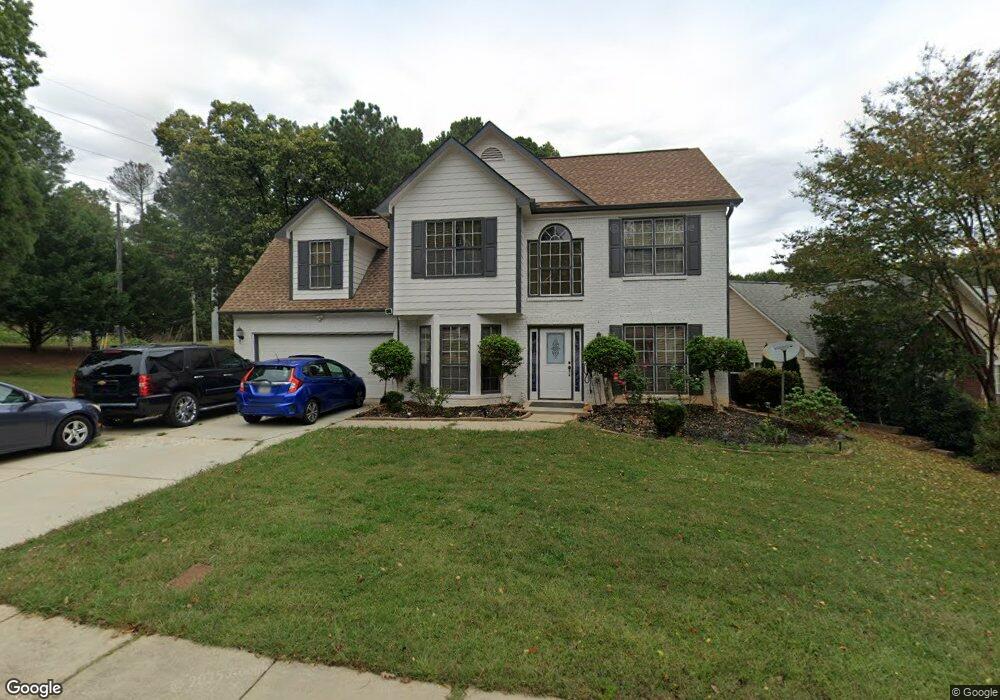
765 Peachtree Trails Dr Suwanee, GA 30024
Estimated Value: $429,000 - $457,000
3
Beds
3
Baths
2,135
Sq Ft
$205/Sq Ft
Est. Value
About This Home
This home is located at 765 Peachtree Trails Dr, Suwanee, GA 30024 and is currently estimated at $438,183, approximately $205 per square foot. 765 Peachtree Trails Dr is a home located in Gwinnett County with nearby schools including Walnut Grove Elementary School, Creekland Middle School, and Collins Hill High School.
Ownership History
Date
Name
Owned For
Owner Type
Purchase Details
Closed on
May 31, 2005
Sold by
Morris Kenia J
Bought by
Morris Kenia J
Current Estimated Value
Home Financials for this Owner
Home Financials are based on the most recent Mortgage that was taken out on this home.
Original Mortgage
$170,000
Outstanding Balance
$97,019
Interest Rate
7.45%
Mortgage Type
New Conventional
Estimated Equity
$341,164
Purchase Details
Closed on
May 27, 2005
Sold by
Scott Gregory W
Bought by
Morris Kenia J
Home Financials for this Owner
Home Financials are based on the most recent Mortgage that was taken out on this home.
Original Mortgage
$170,000
Outstanding Balance
$97,019
Interest Rate
7.45%
Mortgage Type
New Conventional
Estimated Equity
$341,164
Purchase Details
Closed on
Nov 23, 1999
Sold by
Bomar Properties Inc
Bought by
Scott Gregory W
Home Financials for this Owner
Home Financials are based on the most recent Mortgage that was taken out on this home.
Original Mortgage
$136,850
Interest Rate
7.94%
Mortgage Type
New Conventional
Create a Home Valuation Report for This Property
The Home Valuation Report is an in-depth analysis detailing your home's value as well as a comparison with similar homes in the area
Home Values in the Area
Average Home Value in this Area
Purchase History
| Date | Buyer | Sale Price | Title Company |
|---|---|---|---|
| Morris Kenia J | -- | -- | |
| Morris Kenia J | $170,000 | -- | |
| Scott Gregory W | $144,100 | -- |
Source: Public Records
Mortgage History
| Date | Status | Borrower | Loan Amount |
|---|---|---|---|
| Open | Morris Kenia J | $170,000 | |
| Previous Owner | Scott Gregory W | $136,850 |
Source: Public Records
Tax History Compared to Growth
Tax History
| Year | Tax Paid | Tax Assessment Tax Assessment Total Assessment is a certain percentage of the fair market value that is determined by local assessors to be the total taxable value of land and additions on the property. | Land | Improvement |
|---|---|---|---|---|
| 2025 | $1,043 | $160,400 | $26,320 | $134,080 |
| 2024 | $1,041 | $159,200 | $32,000 | $127,200 |
| 2023 | $1,041 | $153,160 | $32,000 | $121,160 |
| 2022 | $1,003 | $138,440 | $27,600 | $110,840 |
| 2021 | $985 | $104,200 | $21,600 | $82,600 |
| 2020 | $3,052 | $97,040 | $18,640 | $78,400 |
| 2019 | $2,977 | $97,040 | $18,640 | $78,400 |
| 2018 | $2,664 | $82,520 | $14,000 | $68,520 |
| 2016 | $2,430 | $70,680 | $14,000 | $56,680 |
| 2015 | $2,447 | $70,680 | $14,000 | $56,680 |
| 2014 | $2,266 | $61,920 | $11,600 | $50,320 |
Source: Public Records
Map
Nearby Homes
- 295 Old Peachtree Rd NW
- 390 Manor Glen Dr
- 1365 Old Peachtree Rd NW
- 620 Telfair Ct
- 2689 Richmond Row Dr
- 487 Danville Ave
- 2470 Jakin Way
- 1953 Frisco Way
- 2430 Jakin Way
- 578 Summerbrooke Ct
- 401 Northaven Ave
- 2538 Brentmoor Ct
- 2538 Brynfield Cove
- 715 Welford Rd
- 2305 Compton Place
- 2445 Whitehead Place Dr
- 4183 Valtek Ct
- 971 Heathchase Dr
- 745 Peachtree Trails Dr
- 735 Peachtree Trails Dr
- 2752 Peachtree Trails Ct
- 2762 Peachtree Trails Ct
- 750 Peachtree Trails Dr
- 740 Peachtree Trails Dr
- 760 Peachtree Trails Dr
- 725 Peachtree Trails Dr
- 730 Peachtree Trails Dr
- 2763 Peachtree Trails Ct
- 720 Peachtree Trails Dr
- 705 Peachtree Trails Dr
- 341 Old Peachtree Rd NW
- 341 Old Peachtree Rd NW
- 0 Peachtree Trails Dr Unit 7256102
- 0 Peachtree Trails Dr Unit 8882975
- 0 Peachtree Trails Dr Unit 3251563
- 0 Peachtree Trails Dr Unit 7407314
- 341 Old Peachtree Rd NW
- 2732 Peachtree Trails Ct