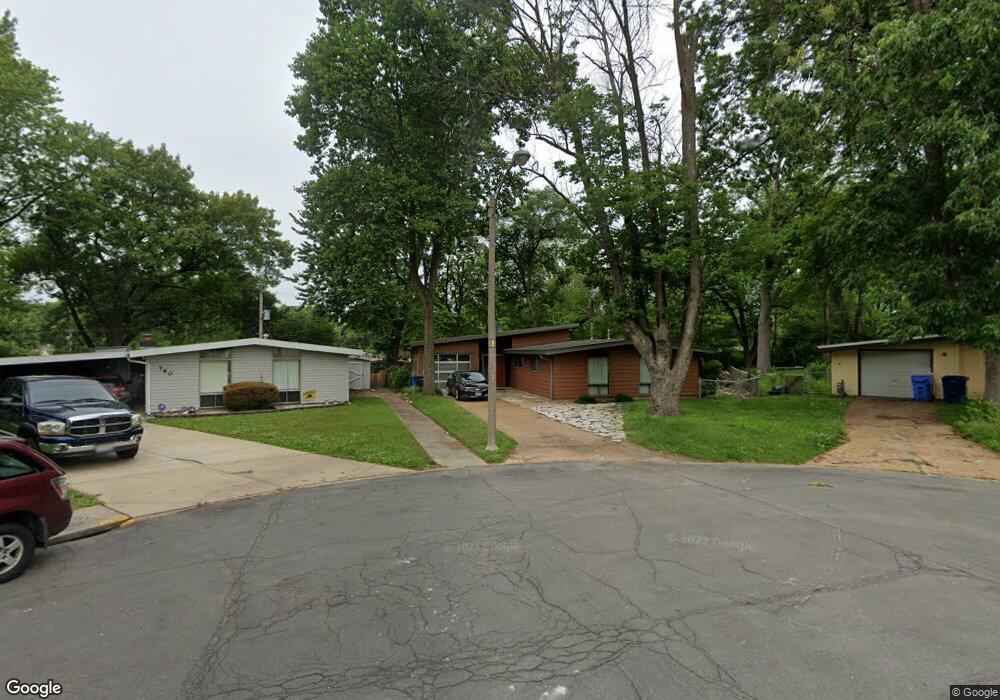
765 Pebble Ln Florissant, MO 63033
Estimated Value: $117,000 - $166,000
3
Beds
2
Baths
1,196
Sq Ft
$125/Sq Ft
Est. Value
About This Home
This home is located at 765 Pebble Ln, Florissant, MO 63033 and is currently estimated at $149,667, approximately $125 per square foot. 765 Pebble Ln is a home located in St. Louis County with nearby schools including Robinwood Elementary School, Cross Keys Middle School, and McCluer North High School.
Ownership History
Date
Name
Owned For
Owner Type
Purchase Details
Closed on
Jun 24, 2015
Sold by
Moler James M and Moler Judith L
Bought by
Brown Orlando K
Current Estimated Value
Home Financials for this Owner
Home Financials are based on the most recent Mortgage that was taken out on this home.
Original Mortgage
$150,000
Outstanding Balance
$116,839
Interest Rate
3.91%
Mortgage Type
Future Advance Clause Open End Mortgage
Estimated Equity
$32,828
Purchase Details
Closed on
Sep 11, 2008
Sold by
Us Bank Na
Bought by
Moler James W and Moler Judith L
Purchase Details
Closed on
Aug 29, 2006
Sold by
Cotton Lori L
Bought by
Perry Stephen Michael and Perry Merissa Christine
Home Financials for this Owner
Home Financials are based on the most recent Mortgage that was taken out on this home.
Original Mortgage
$92,000
Interest Rate
11.32%
Mortgage Type
Purchase Money Mortgage
Create a Home Valuation Report for This Property
The Home Valuation Report is an in-depth analysis detailing your home's value as well as a comparison with similar homes in the area
Home Values in the Area
Average Home Value in this Area
Purchase History
| Date | Buyer | Sale Price | Title Company |
|---|---|---|---|
| Brown Orlando K | $150,000 | Investors Title Co Clayton | |
| Moler James W | $42,230 | Mo Kan Title Services Inc | |
| Perry Stephen Michael | $30,000 | Freedom Title |
Source: Public Records
Mortgage History
| Date | Status | Borrower | Loan Amount |
|---|---|---|---|
| Open | Brown Orlando K | $150,000 | |
| Previous Owner | Perry Stephen Michael | $92,000 |
Source: Public Records
Tax History Compared to Growth
Tax History
| Year | Tax Paid | Tax Assessment Tax Assessment Total Assessment is a certain percentage of the fair market value that is determined by local assessors to be the total taxable value of land and additions on the property. | Land | Improvement |
|---|---|---|---|---|
| 2025 | $1,611 | $28,520 | $5,950 | $22,570 |
| 2024 | $1,611 | $20,620 | $4,470 | $16,150 |
| 2023 | $1,606 | $20,620 | $4,470 | $16,150 |
| 2022 | $1,935 | $21,990 | $4,470 | $17,520 |
| 2021 | $1,902 | $21,990 | $4,470 | $17,520 |
| 2020 | $1,679 | $18,240 | $3,440 | $14,800 |
| 2019 | $1,647 | $18,240 | $3,440 | $14,800 |
| 2018 | $1,529 | $15,110 | $2,000 | $13,110 |
| 2017 | $1,520 | $15,110 | $2,000 | $13,110 |
| 2016 | $966 | $9,260 | $2,000 | $7,260 |
| 2015 | $972 | $9,260 | $2,000 | $7,260 |
| 2014 | $829 | $8,110 | $3,150 | $4,960 |
Source: Public Records
Map
Nearby Homes
- 785 Bobbins Ln
- 2320 Allen Dr
- 750 Robinwood Dr
- 805 Derhake Rd
- 12 Country Ln
- 2240 Brook Dr
- 13 Bayberry Ln
- 505 Ridge Dr
- 2020 Washington St Unit 707
- 2340 Saint Catherine St
- 105 Capri Dr
- 2505 Saint Catherine St
- 130 Dauphin Ln
- 265 Waterford Dr
- 1965 Saint Catherine St
- 675 Pimlico Dr
- 375 Waterford Dr
- 415 Waterford Dr
- 190 Coteau Ln
- 2 Carson Ct