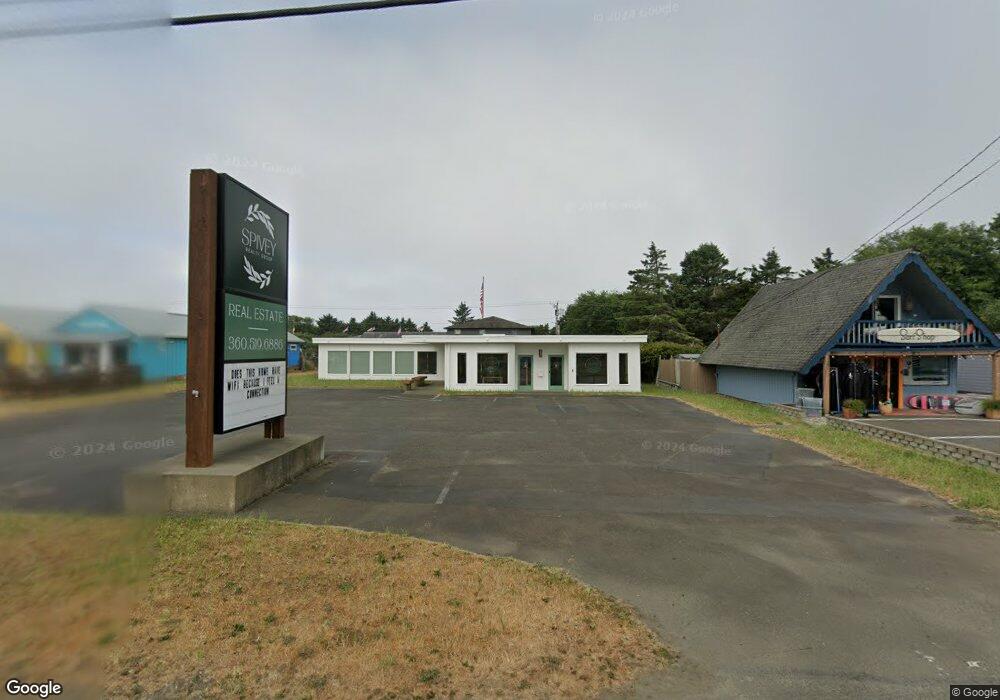
765 Point Brown Ave NW Ocean Shores, WA 98569
Estimated Value: $516,674
--
Bed
--
Bath
2,970
Sq Ft
$174/Sq Ft
Est. Value
About This Home
This home is located at 765 Point Brown Ave NW, Ocean Shores, WA 98569 and is currently estimated at $516,674, approximately $173 per square foot. 765 Point Brown Ave NW is a home located in Grays Harbor County with nearby schools including North Beach Junior/Senior High School.
Ownership History
Date
Name
Owned For
Owner Type
Purchase Details
Closed on
Dec 12, 2023
Sold by
Ocean Shores Salt Llc
Bought by
Spivey Realty Group Llc
Current Estimated Value
Home Financials for this Owner
Home Financials are based on the most recent Mortgage that was taken out on this home.
Original Mortgage
$399,000
Outstanding Balance
$392,377
Interest Rate
7.5%
Mortgage Type
New Conventional
Estimated Equity
$124,297
Purchase Details
Closed on
Nov 1, 2012
Sold by
Utterback Lending Llc
Bought by
Ocean Shores Salt Llc
Home Financials for this Owner
Home Financials are based on the most recent Mortgage that was taken out on this home.
Original Mortgage
$165,000
Interest Rate
3.43%
Mortgage Type
Seller Take Back
Purchase Details
Closed on
Jul 14, 2011
Sold by
759 Point Brown Inc
Bought by
Utterback Lending Llc
Purchase Details
Closed on
Sep 17, 2008
Sold by
The North Beach Company Llc
Bought by
759 Point Brown Inc
Purchase Details
Closed on
Oct 19, 2007
Sold by
The City Of Ocean Shores
Bought by
The North Beach Company Llc
Home Financials for this Owner
Home Financials are based on the most recent Mortgage that was taken out on this home.
Original Mortgage
$400,000
Interest Rate
6.29%
Mortgage Type
Purchase Money Mortgage
Create a Home Valuation Report for This Property
The Home Valuation Report is an in-depth analysis detailing your home's value as well as a comparison with similar homes in the area
Home Values in the Area
Average Home Value in this Area
Purchase History
| Date | Buyer | Sale Price | Title Company |
|---|---|---|---|
| Spivey Realty Group Llc | $499,000 | None Listed On Document | |
| Ocean Shores Salt Llc | $165,000 | Grays Harbor Title | |
| Utterback Lending Llc | -- | Grays Harbor Title | |
| 759 Point Brown Inc | -- | Accommodation | |
| The North Beach Company Llc | -- | Grays Harbor Title |
Source: Public Records
Mortgage History
| Date | Status | Borrower | Loan Amount |
|---|---|---|---|
| Open | Spivey Realty Group Llc | $399,000 | |
| Previous Owner | Ocean Shores Salt Llc | $165,000 | |
| Previous Owner | The North Beach Company Llc | $400,000 |
Source: Public Records
Tax History Compared to Growth
Tax History
| Year | Tax Paid | Tax Assessment Tax Assessment Total Assessment is a certain percentage of the fair market value that is determined by local assessors to be the total taxable value of land and additions on the property. | Land | Improvement |
|---|---|---|---|---|
| 2025 | $2,927 | $462,198 | $117,168 | $345,030 |
| 2023 | $2,678 | $416,916 | $151,020 | $265,896 |
| 2022 | $2,872 | $339,816 | $86,280 | $253,536 |
| 2021 | $3,117 | $339,816 | $86,280 | $253,536 |
| 2020 | $2,908 | $301,867 | $86,280 | $215,587 |
| 2019 | $2,820 | $270,988 | $75,000 | $195,988 |
| 2018 | $2,983 | $255,988 | $60,000 | $195,988 |
| 2017 | $2,757 | $255,988 | $60,000 | $195,988 |
| 2016 | $2,848 | $231,515 | $54,000 | $177,515 |
| 2014 | -- | $248,950 | $67,500 | $181,450 |
| 2013 | -- | $208,000 | $75,000 | $133,000 |
Source: Public Records
Map
Nearby Homes
- 895 Minard Ave NW
- 766 Ocean Ct NW Unit 206
- 766 Ocean Ct NW Unit 205
- 766 Ocean Ct NW Unit 212
- 757 Ocean Ct NW Unit 20
- 114 E Chance A La Mer NE Unit 207
- 811 Minard Ave NW
- 804 Anchor Ave NW
- 734 S Rain St NE
- 200 E Chance A La Mer NE
- 679 Point Brown Ave NW
- 810 Magellan Ave NE
- 844 Point Brown Ave NE
- 739 Park Ave NE
- 821 Ocean Shores Blvd NW
- 856 Trinidad Ct NE
- 835 Ocean Shores Blvd NW Unit 307
- 835 Ocean Shores Blvd NW Unit 305
- 835 Ocean Shores Blvd NW Unit 205
- 835 Ocean Shores Blvd NW Unit 208
- 759 Point Brown Ave NW Unit E
- 759 Point Brown Ave NW Unit G
- 759 Point Brown Ave NW Unit E
- 759 Point Brown Ave NW Unit G
- 759 Pt Brown Ave NW Unit B
- 759 Pt Brown Ave NW Unit F
- 759 Point Brown Ave NW Unit A
- 759 Pt Brown Ave NW Unit C
- 759 Pt Brown Ave NW Unit D
- 759 Point Brown Ave NW Unit C
- 759 Point Brown Ave NW Unit F
- 759 Pt Brown Ave NW Unit E
- 759 Point Brown Ave NW Unit A
- 759 Point Brown Ave NW Unit B
- 759 Pt Brown Ave NW Unit F
- 759 Pt Brown Ave NW Unit B
- 759 Pt Brown Ave NW Unit G
- 759 Pt Brown Ave NW
- 773 Point Brown Ave NW
- 767 Minard Ave NW